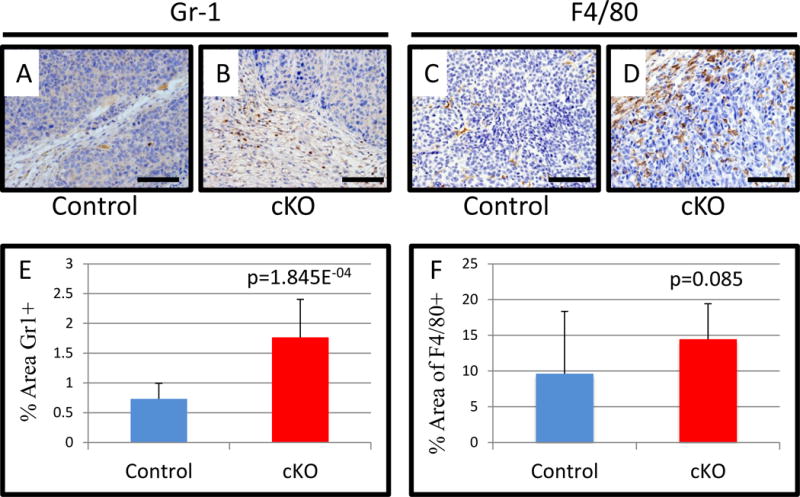
Figure 5. Tumors implanted with fibroblasts deleted for BMPR2 have increased inflammatory cells.

A) Representative images of PyVmT tumors with either control or cKO fibroblasts stained by IHC for Ly6c/g(Gr-1). C–D) Representative images of F4/80 IHC of implanted PyVmT tumors with either control or cKO fibroblasts. E) Quantification of Gr-1+ % area of control and cKO tumors. F) Quantification of F4/80 % area in control and cKO tumors. Scale bars =50μM. Significance was determined by students t-test. Error bars indicate SD.
