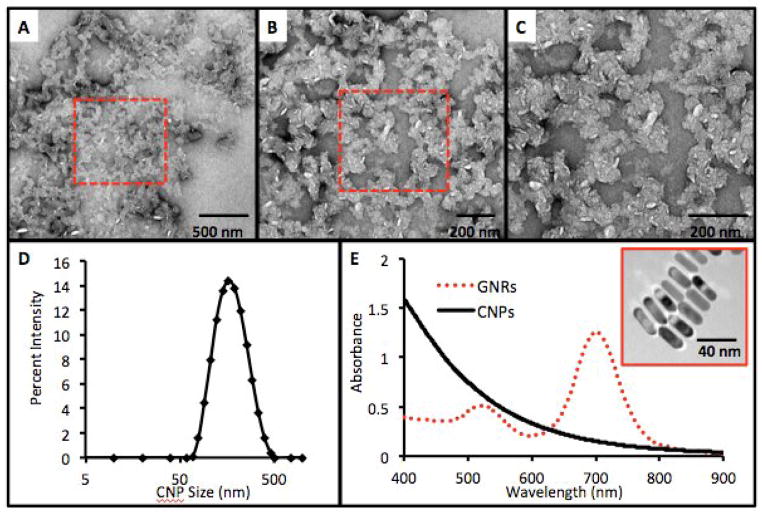
Figure 1. Physical Characterization of CNPs.
CNPs were examined with TEM at increasing magnification (A–C) and show amorphous and anisotropically shaped nanoparticles with dimensions of 132 ± 46 nm. Red box in panels A and B indicated the subsequent higher magnification image in panel C. D) The hydrodynamic radius by DLS was 196.0 nm with a PDI of 0.138. E) The absorbance spectra of CNPs at 0.077 mg/mL (0.023 nM) in PBS show Rayleigh scattering with maximum absorbance in the UV visible region (black line). This is in contrast to gold nanorods at 0.34 nM (red dashed line) with a resonance tuned to 700 nm. Inset in E shows gold nanorods with dimensions of 40.0 × 13.2 nm used for signal comparisons.

