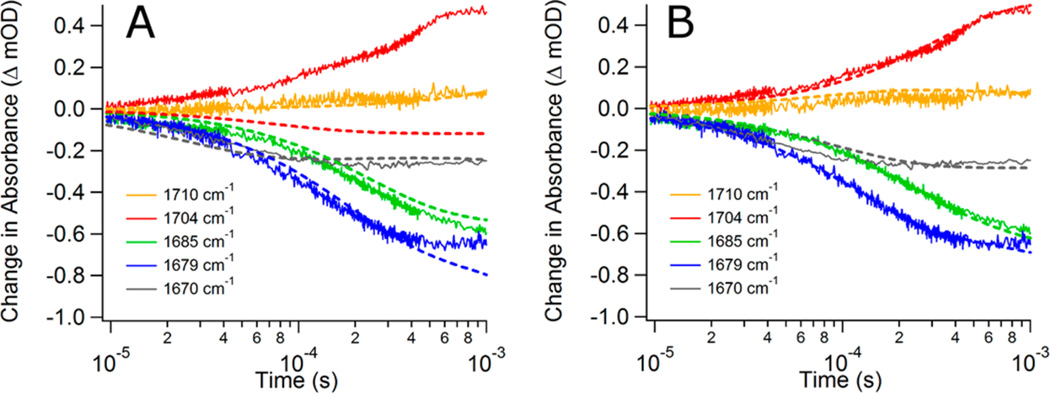
Figure 4.
Comparison of the simulated relaxation kinetics (dashed lines) with the experimental data (solid lines). Graph A uses Scheme 1 as the reaction model for simulated results. Graph B uses Scheme 2 as the reaction model for simulated results. The most significant change is the better fit for the 1704 cm−1 transient when Scheme 2 is used.

