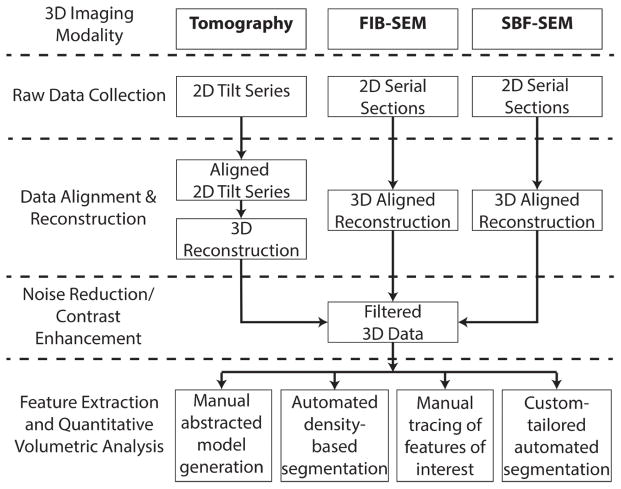
Figure 1. Workflow for biological imaging reconstruction and analysis.
This chart gives an overview of the various steps taken to collect and process images collected by tomography, focused ion beam SEM, and serial block face SEM. Raw data collection results in 2D tilt series or serial sections. These 2D image sets must be aligned and reconstructed into 3D, then filtered in order to reduce noise and enhance the contrast of features of interest. Finally, the data can be segmented and analyzed by four methods, ultimately resulting in a 3D model.

