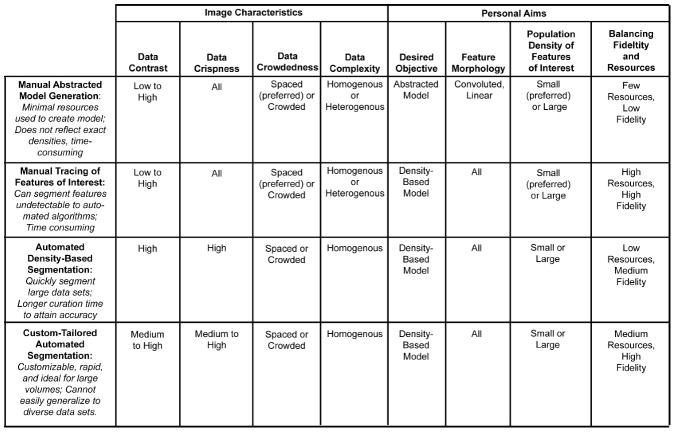
Figure 5. Comparison table of data characteristics appropriate for different segmentation approaches.
This table summarizes the strengths and limitations of each segmentation approach. The criteria from Figure 4 can help identify which datasets are suitable for which segmentation method. These subjective personal aims and objective image characteristics were chosen for optimal use of each approach, but different combinations may hinder or aid the efficiency of the segmentation.

