
Figure 4.
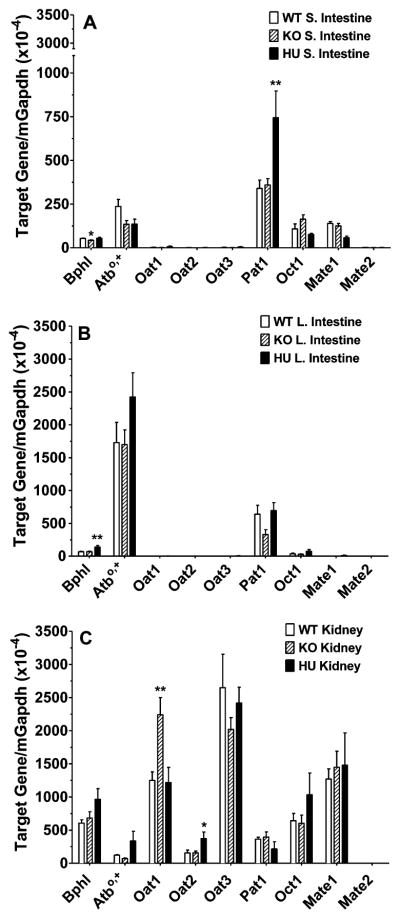
Real time-PCR analyses of select transporters and enzymes in the small intestine (A), large intestine (B), and kidney (C) of wildtype (WT = mPept1+/+), Pept1 knockout (KO = mPept1−/−), and humanized PEPT1 (HU = mPept1−/−/hPEPT1+/−) mice. Refer to Table 1 for gene identification. Data are expressed as mean ± SE (n = 4–6). *p < 0.05 and **p < 0.01, as evaluated by ANOVA/Dunnett’s analyses in which WT was the control group. Note the discontinuous y-axis in panel A.