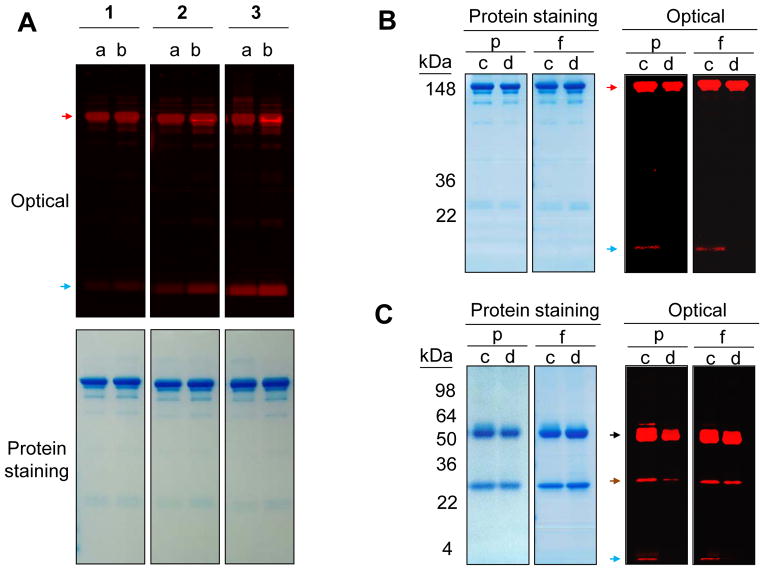
Figure 6.
(A) SDS-PAGE of the SE-HPLC-isolated ICG-sOSu-panitumumab (1, 2, and 3). a: samples collected from SE-HPLC RT 18.5 to 20.5 min; b: samples collected from HPLC RT 19 – 20 min. (B–C) SDS-PAGE of SE-HPLC-isolated ICG-sOSu-panitumumab before (c, 2) and after (d, 5) extraction by ethyl acetate under (B) non-reducing and (C) reducing condition. Samples were loaded with the same protein level (p) or equal amount of fluorophore (f). Colloidal blue protein staining and optical imaging were performed after development. Black arrow: heavy chain; brown arrow: light chain; blue arrow: free dye; red arrow: desired conjugation product.

