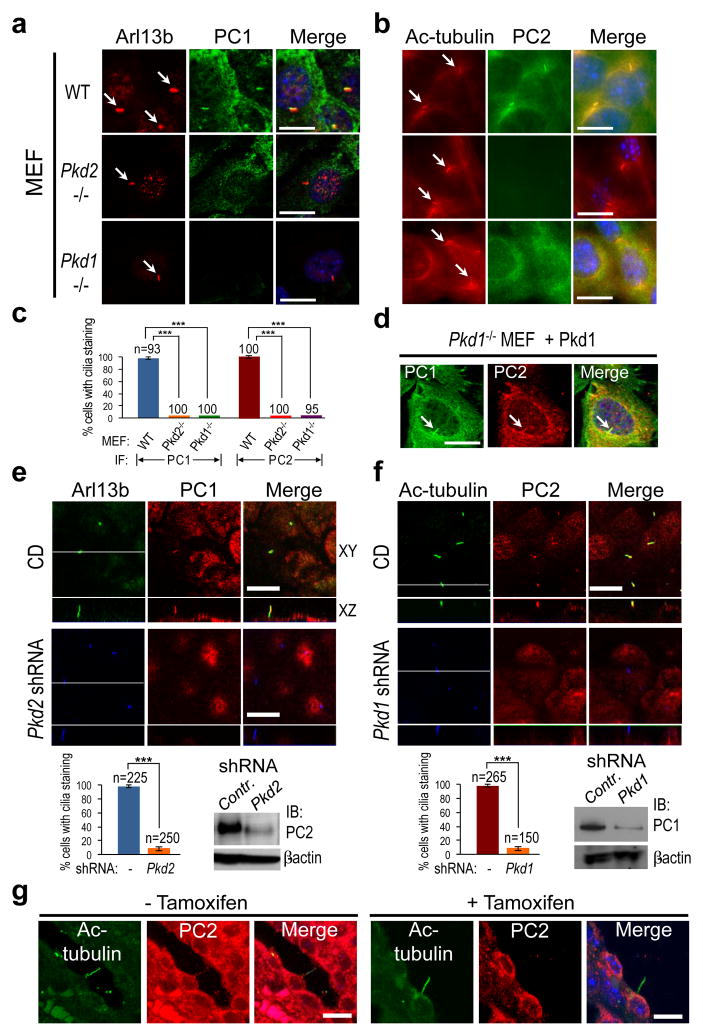
Figure 1.
Native PC1 and PC2 regulate each other’s ciliary localization in vivo. (a–b) Representative immunofluorescence images of MEFs with indicated genotypes subjected to 24_h serum starvation. Cells were stained with anti-PC1 (E4, Supplementary Fig. 5) and analyzed by confocal microscopy (a), or stained with anti-PC2 and analyzed by epifluorescence microscopy (b). Arl13b or acetylated (Ac)-tubulin was used as a ciliary marker. Arrows indicate cilia. (c) The bar diagram shows the quantification of PC1 or PC2 ciliary localization in MEFs with various genotypes with numbers of cells analyzed (n) indicated; *** p<0.001. (d) Exogenously expressed PC1 traffics to cilia (arrow) and rescues ciliary localization of PC2 in Pkd1−/− MEFs. Exogenous expression of GFP served as a negative control (Supplementary Fig. 1).(e) Confocal images of CD cells (upper panel) and CD cells expressing Pkd2shRNA (lower panel). Cells were stained with antibodies against Arl13b (blue) and PC1(E4) (red). The bar diagram below shows the quantification of PC1 ciliary localization in CD and cells with Pkd2 knockdown performed from four independent experiments with numbers of cells analyzed (n) indicated; *** p<0.001. Western blot analysis shows that Pkd2 shRNA reduced endogenous PC2 level by ~90%. (f) Confocal images of CD cells (upper panel) and cells expressing Pkd1shRNA, stained with antibodies as indicated. Four different Pkd1 shRNAs had similar results. The bar diagram shows the quantification of PC2 ciliary localization between CD and cells with Pkd1 knock down from four independent experiments; *** p<0.001. Western blot analysis shows that Pkd1shRNA reduced endogenous PC1 level by ~90%. The white line in the XY scan in (e, f) indicates the path of the XZ scan. (g) Confocal images of PC2 ciliary localization in collecting duct at P28 in Pkd1cko/cko:tamoxifen-Cre mouse kidney33, in which Pkd1 was not inactivated (left panel, normal tubule) or inactivated by tamoxifen injection on P10 (right panel, cystic tubule). PC2 was detected in 21 of 21 cilia (red) in normal kidneys. Cilia were marked by acetylated tubulin (green). Note that PC2 was not detectable in 18 of 18 cilia of cysts analyzed. Scale bar, 10 μm.

