Figure 1.
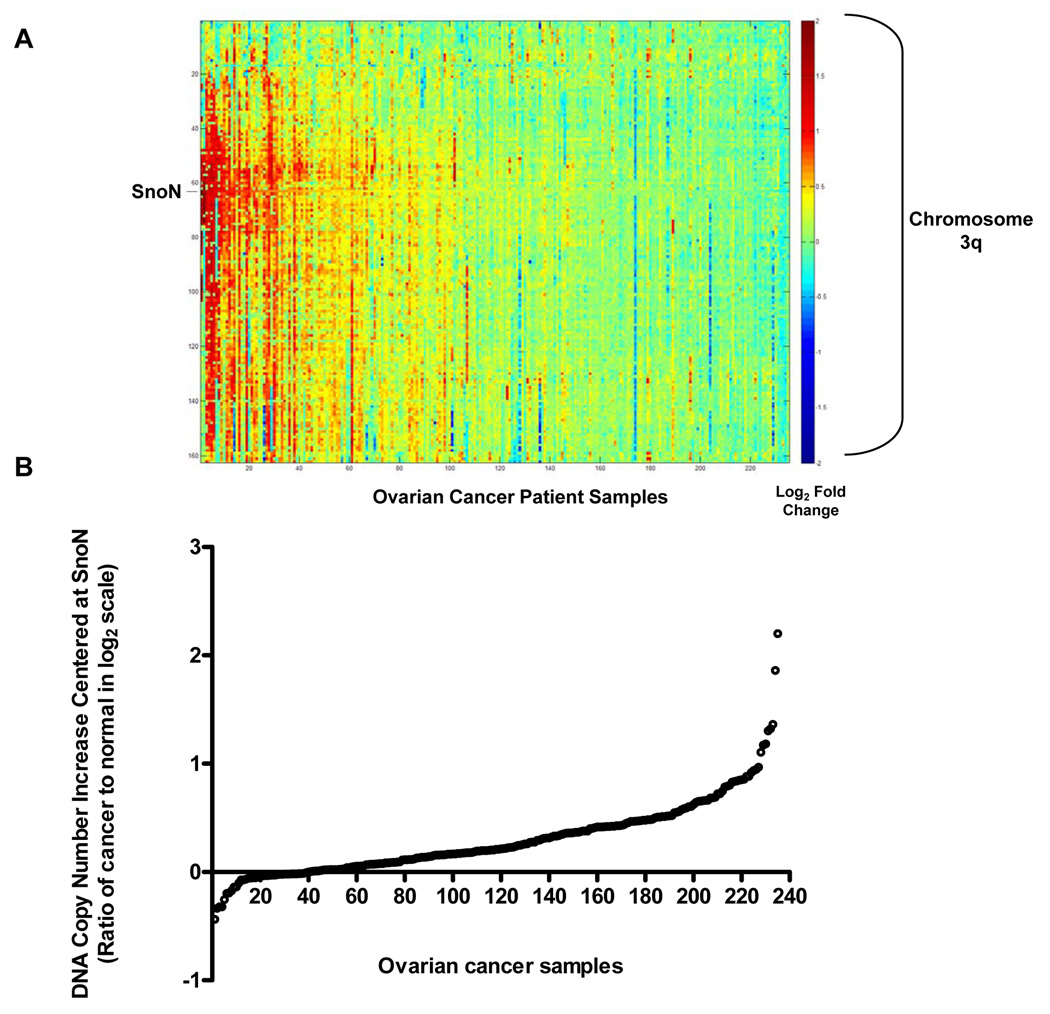
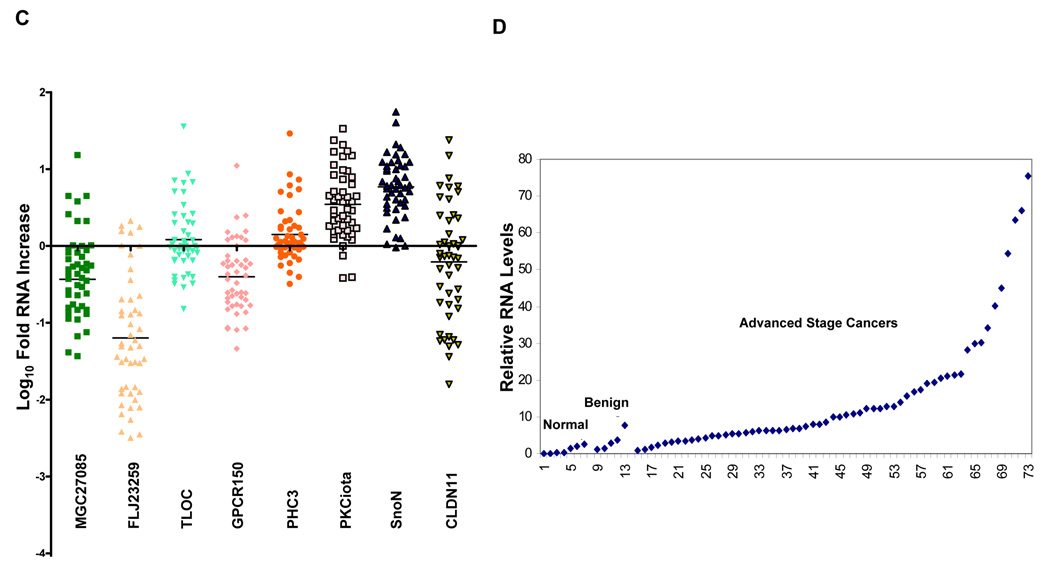
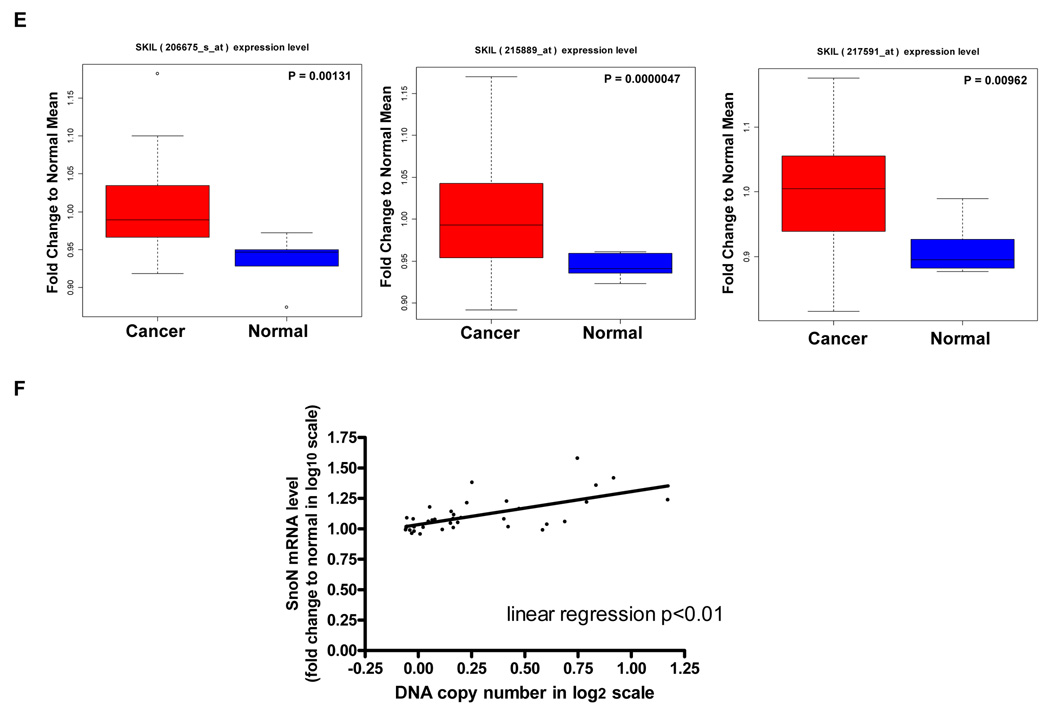
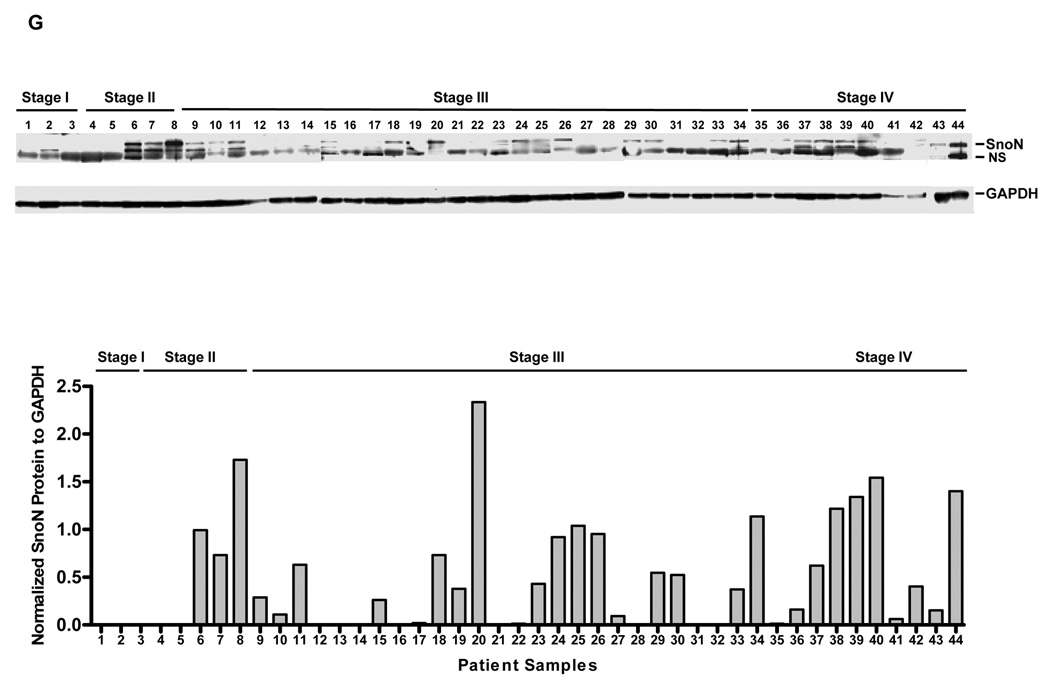
SnoN genomic copy number increase is associated with a selective accumulation of SnoN transcripts. A, Comparative genomic hybridization (CGH) analysis for 235 ovarian tumors using a contig encompassing 163 bacterial artificial chromosomes (BACs) probes on 3q is shown as a scaled image map. The patient samples are ordered with respect to decreasing SnoN copy number alterations from left to right. The BACs on chromosome 3q are ordered by position along the chromosome. The region on 3q from MGC27085 to CLDN11 (Chr3: 170993963-171634589) was one of the most frequently altered regions on 3q. A log2 value of 0.5 equals a gain of 1 copy. B, CGH analysis of DNA copy number increase centered at SnoN in 235 advanced stage serous epithelial ovarian cancers represented at log2 ratio of cancer patient DNA to normal DNA. C, RNA expression levels of genes surrounding SnoN along chromosome 3q, from MGC27085 to CLDN11, were assessed by quantitative polymerase chain reaction (qPCR) analysis in ovarian tissue samples. The results are displayed as fold-alterations in RNA expression for normal ovarian epithelium, benign tumor samples, and advanced tumors (stage III and IV), compared to the average of the normal epithelium. MGC27085 and FLJ23259 are anonymous transcripts, TLOC is translocation protein 1, GPCR150 is G-protein coupled receptor 150 (GPR160), and PHC3 is polyhomeotic-like 3, PKCι is protein kinase C iota, SnoN is Ski-like, and CLDN11 is claudin 11. D, The results from Figure 1B are displayed as log10-foldalterations in RNA expression for average of the normal and benign patient samples relative to advanced stage ovarian cancer patient samples. E, Transcriptional profiling of the UCSF ovarian dataset showing the elevated SnoN RNA expression with 3 probes and displayed as fold change to normal mean. 69 patients were analyzed in the “cancer” group while 6 benign tumors were analyzed in the “normal” group. F, DNA to RNA concordance analysis for SnoN in ovarian patient samples. G Western analysis was performed across 3 stage I, 5 stage II, 26 stage III, and 10 stage IV serous epithelial ovarian cancer patients using SnoN rabbit polyclonal antibody and GAPDH as a loading control (top panel). Densitometric analysis was performed to normalize SnoN levels relative to GAPDH levels (bottom panel). NS refers to a non-specific band detected with the SnoN polyclonal antibody.


