Figure 1.

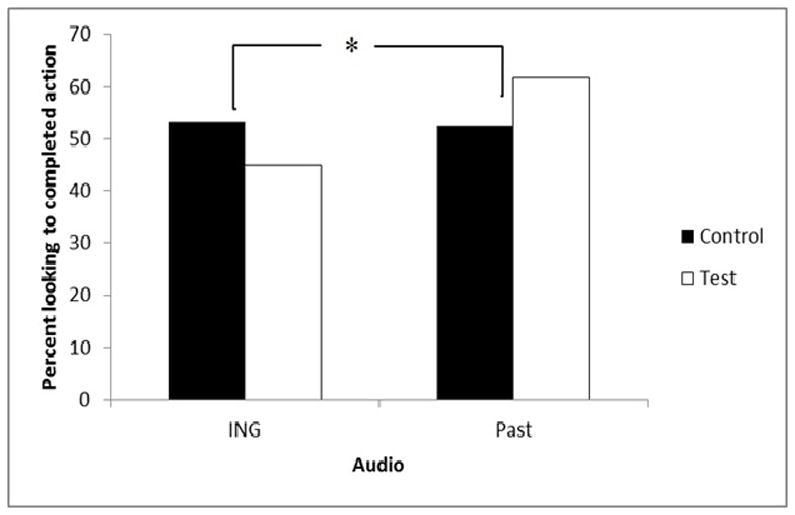
Percentage of looking time spent on the completed actions during the control trials compared with the first half of the test trials, *p < 0.05

Percentage of looking time spent on the completed actions during the control trials compared with the first half of the test trials, *p < 0.05