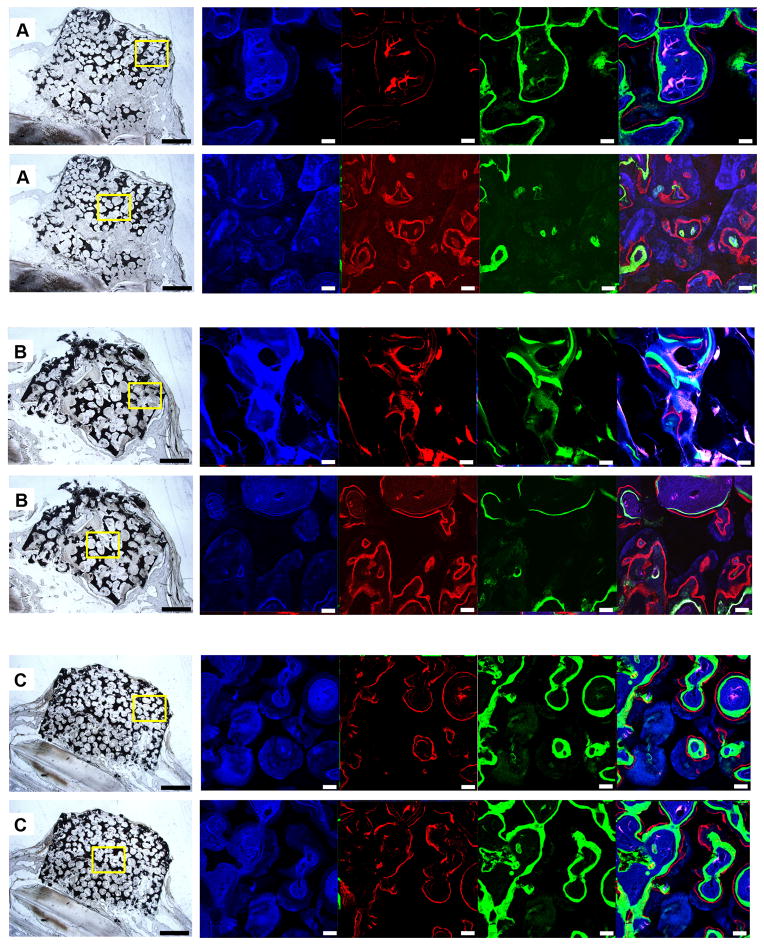
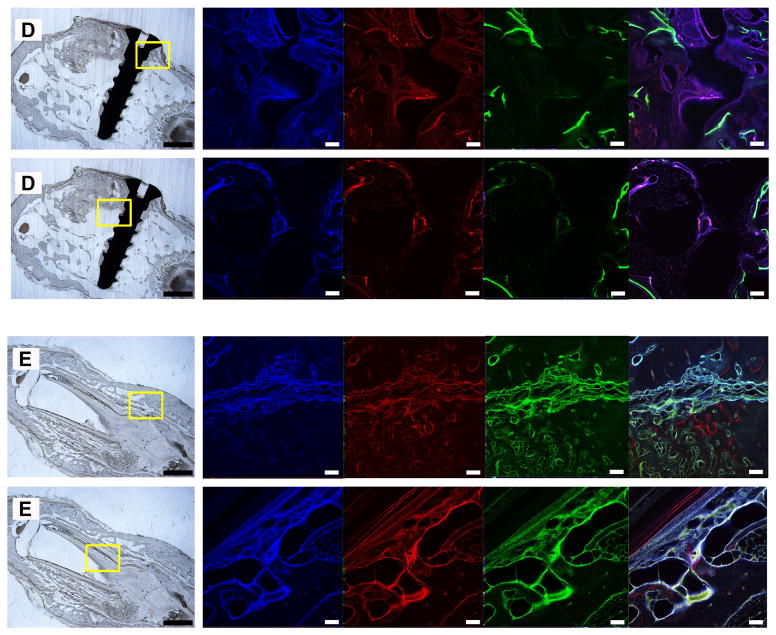
Figure 3.
Fluorescent labeling of new bone formation over time. A, B, C, D, and E show images of GP, LP, SP, positive control group, and negative control group. In each sample, 2 fluorescent labeling areas are presented, one in the center of the slices, the other in the outer ring of the slices. Each result includes a general view of the abrasive slice and a series of fluorescent labeled images captured after excitation at different wavelengths. There are 4 fluorescent labeled images in each series. Images in blue, red, and green present the calcified tissue in the first, second, and third month, respectively. The last column in each series shows the computer generated merged images. Scale bars = 1000 μm in abrasive slices; scale bars = 100 μm in fluorescent labeled images.


