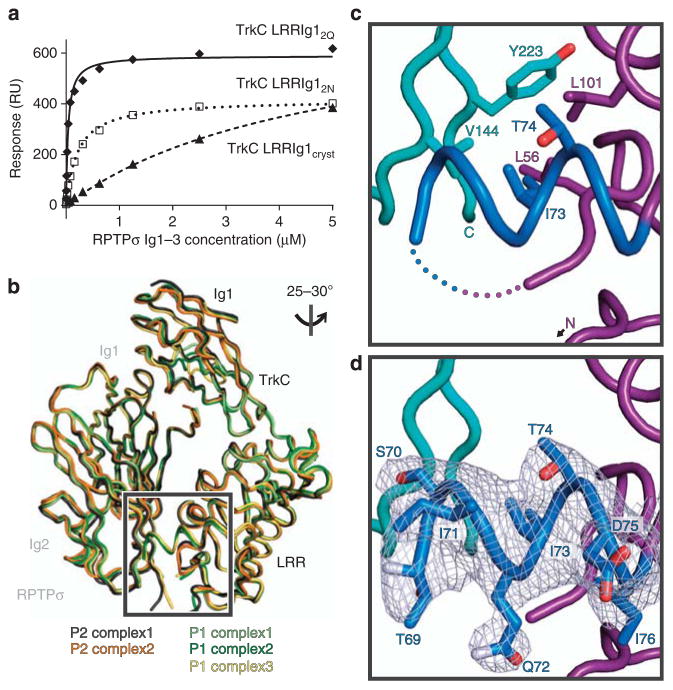
Figure 5. Characterization of the potential accessory RPTPσ:TrkC-binding site 4.
(a) SPR analysis of chicken RPTPσ Ig1–3 binding to immobilized chicken TrkC LRRIg1cryst, LRRIg12N and LRRIg12Q. Measured binding values: TrkC LRRIg1cryst, Kd = 4.8 μM and Bmax = 761 RU; LRRIg12N, Kd = 216 nM and Bmax = 416 RU; LRRIg12Q, Kd = 38 nM and Bmax = 590 RU. For sensograms see Supplementary Fig. 8g–h. (b) Alignment of the two RPTPσ:TrkC complexes observed in the chicken RPTPσ Ig1–2:TrkC LRRIg1cryst (P2 space group) and three in the chicken RPTPσ Ig1–3:TrkC LRRIg12Q (P1 space group) crystal structures. The orientation of the structures is identical to Fig. 2b (lower panel). (c) Additional features observed in complex 1 from the RPTPσ Ig1–3:TrkC LRRIg12Q crystal structure. Residues within the 63–77 loop that were not present in the P2 crystal structure are coloured blue and the remaining missing residues are indicated by dotted lines. View rotated relative to b as indicated. TrkC LRR, magenta; RPTPσ, cyan. (d) SigmaA weighted 2Fo − Fc electron density map (grey) contoured at 1σ and carved at 2.2 Å around loop residues 69–76.

