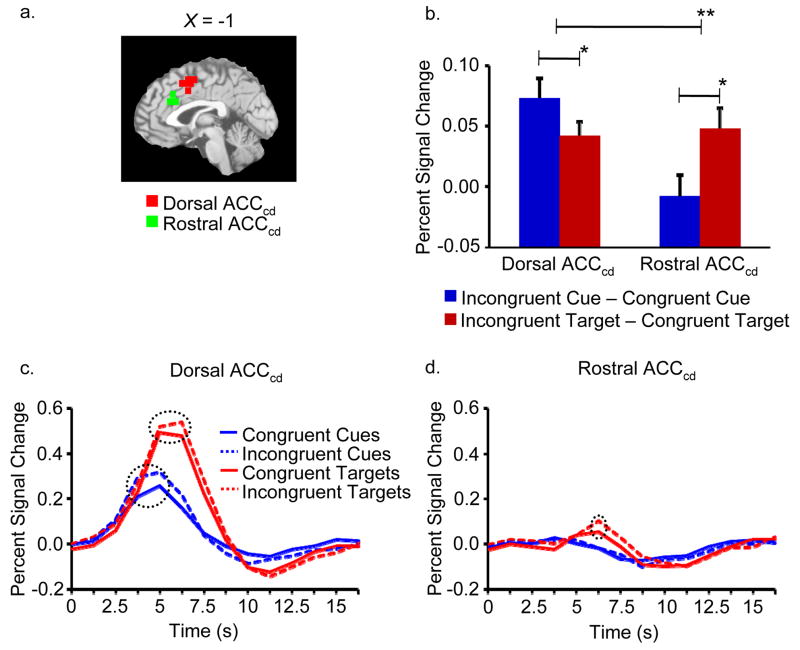
Figure 2.
Regional specialization for cognitive control in the ACCcd. (a) Saggital slice indicating our rostral ACCcd subregion (green) and our dorsal ACCcd subregion (red) on the MNI-normalized brain. (b) Activity specific to cue congruency and target congruency in the dorsal ACCcd and in the rostral ACCcd. In the dorsal ACCcd, we observed significantly greater activity specific to cue congruency than to target congruency, while in the rostral ACCcd we observed exactly the opposite effect. (c) The average fMRI signal across time (in units of percent signal change from baseline) in the dorsal ACCcd for the various cue and target stimuli. There were significant effects of both cue congruency (i.e., greater peak activity for incongruent cues than for congruent cues) and target congruency (i.e., greater peak activity for incongruent target-distracter pairs than for congruent target-distracter pairs). (d) The average fMRI signal across time for the various cue and target stimuli in the rostral ACCcd. There was a significant effect of target congruency, but not of cue congruency. In b, a single asterisk denotes P < 0.05 while two asterisks denote P < 0.005. Error bars represent S.E.M. Dashed circles in c and d indicate significant differences in peak activity (P < 0.05).

