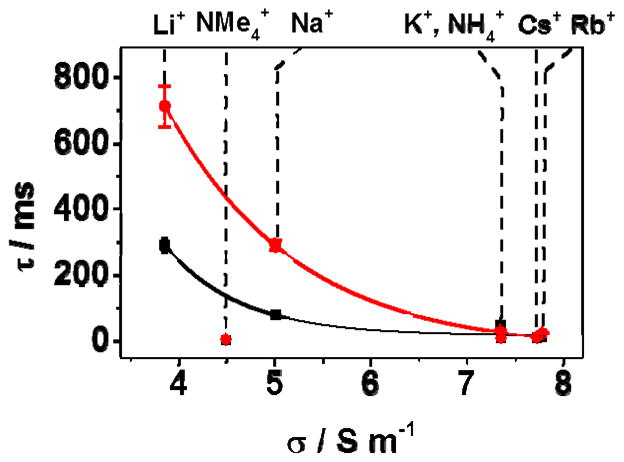
FIGURE 4.

The effect of cation conductivity on the measured duplex unzipping time when a furan site is present at the latch (duplex 9F, black squares) and outside the latch (duplex 13F, red circles). The cation type is indicated on the upper y-axis. Tm measurements for each salt are given in Table S1. Experiments were carried out in 10 mM phosphate buffer (pH 7.5) at 25 °C with electrolyte added at 1.00 M concentration as indicated. Data were recorded at 120 mV (trans vs. cis). Time distribution histograms for each cation are shown in Figure S3.
