Figure 6.
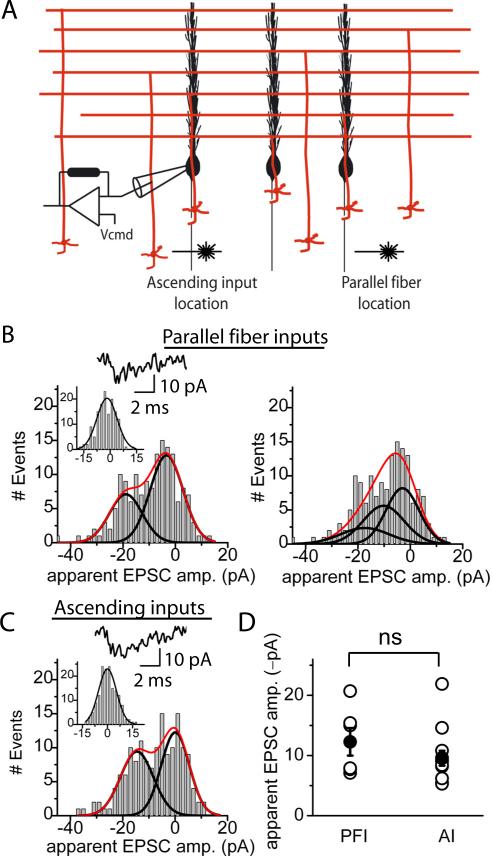
Apparent unitary EPSC amplitudes of parallel fiber and ascending inputs obtained with photolytic activation of granule cells are indistinguishable. A, Glutamate was photore-leased in the granule cell layer within the dendritic plane of the target Purkinje cell to activate ascending inputs and in the granule cell layer at least 100 μm lateral to the dendritic plane to activate parallel fiber inputs. B, Left, The top trace shows the response of a Purkinje cell to photolysis of glutamate onto granule cells which formed parallel fiber synapses. The absolute apparent unitary EPSC amplitude obtained from the sum-of-Gaussians fit to the amplitude histogram (R2 = 0.91, p = 0.9) was 15.5 pA. The inset shows the Gaussian fit to the baseline noise histogram. Right, The amplitude distribution shown in B was force fit using the sum of three Gaussians (1 for failures and 2 for responses, right panel) resulting in an absolute apparent unitary EPSC amplitude of 7.7 pA. When fitting the distribution using the sum of three Gaussians, R2 = 0.86 and p = 0.2. This suggests that 15.5 pA, and not 7.7 pA, is the amplitude that represents the apparent unitary response. C, As in B except the photolysis spot was positioned to activate granule cells giving rise to ascending inputs. The absolute apparent unitary EPSC amplitude obtained from the sum-of-Gaussians fit (R2 = 0.87,p = 0.9) to the amplitude histogram was 14.6pA. D, Scatter plot of individual (open) and mean (filled) absolute apparent unitary granule cell EPSC amplitudes obtained with photolytic stimulation of the granule cell layer. The average absolute apparent unitary EPSC amplitude obtained with photolytic activation of granule cells giving rise to parallel fiber inputs (PFI) was 12.3±2.3pA (n = 6) and that giving rise to ascending inputs (AI) was 9.6 ± 1.2 pA (n = 13).

