
Figure 3. High intrinsic motivation participants show diminished neural responses.
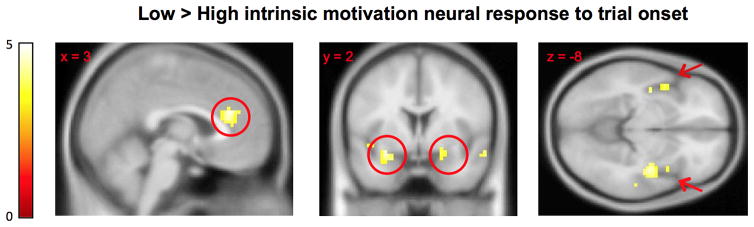
SPM8 t-maps of neural responses to puzzle onset during the puzzle performance period, across the Reward and No Reward groups; two-sample t-test of low intrinsic motivation > high intrinsic motivation groups (t(38) = 3.4; p = 0.0008 uncorrected; p = 0.05, FDR-corrected). The six key regions identified in this contrast (anterior cingulate cortex, amygdala, anterior and posterior insula, PHG, and caudate) were used in subsequent region-of-interest analyses as regions associated with intrinsic motivation.