Fig. 2.
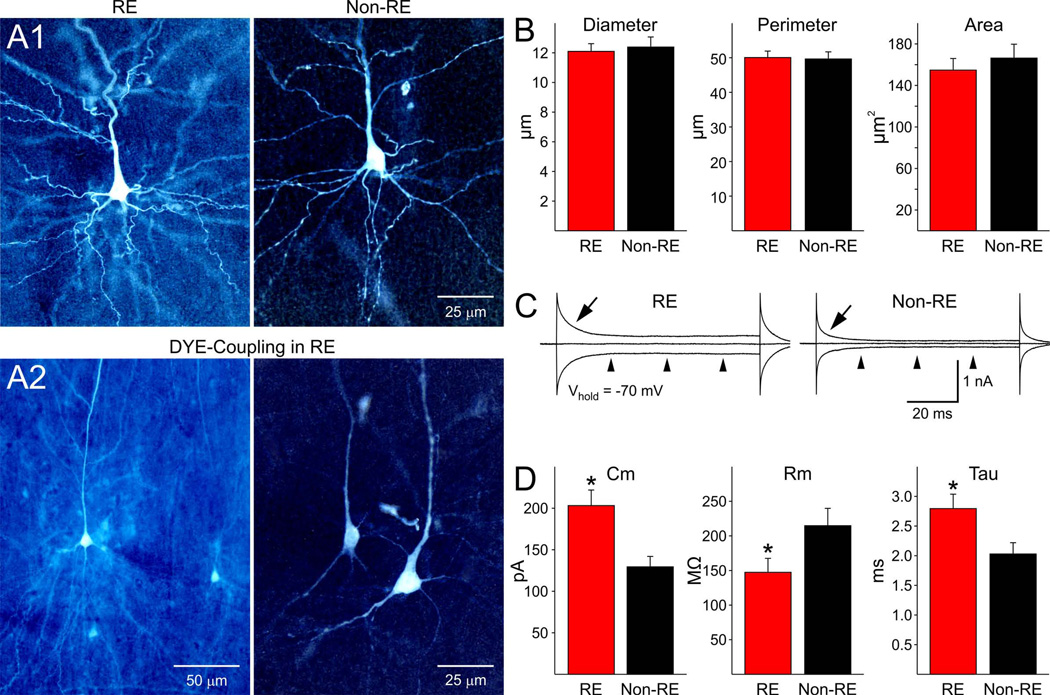
A1. Panels show representative examples of normal-appearing pyramidal neurons from RE and non-RE cases. Cells were recorded and filled with biocytin. They appear similar in terms of somatic area and dendritic elaboration. A2. Examples of dye-coupling in two different RE cases. Only one cell was injected with biocytin, but multiple neurons were labeled, indicating the presence of gap junctions. B. Graphs show morphologic measurements of biocytin-injected neurons from RE and non-RE cases, including average somatic diameter, perimeter and area. C. Example voltage clamp traces illustrating differences in biophysical membrane properties in a pyramidal neuron from a RE compared with a non-RE case. Arrows indicate the decay time constant after a depolarizing step voltage command (10 mV) from a holding potential (Vhold) of −70 mV. Notice that the decay time is much slower in the RE neuron compared with the non-RE neuron, also indicating a much larger cell membrane capacitance. Arrowheads show that the input resistance in the RE neuron is lower than in the non-RE neuron, i.e., the closer the inward or outward current to the midline the higher the input resistance. The cell from the RE case was dye-coupled. D. Graphs show average basic membrane properties of pyramidal neurons from RE and non-RE cases. Cm=cell membrane capacitace, Rm=membrane input resistance and Tau=decay time constant. Statistically significant differences (indicated by asterisks) were found.

