Fig. 7.
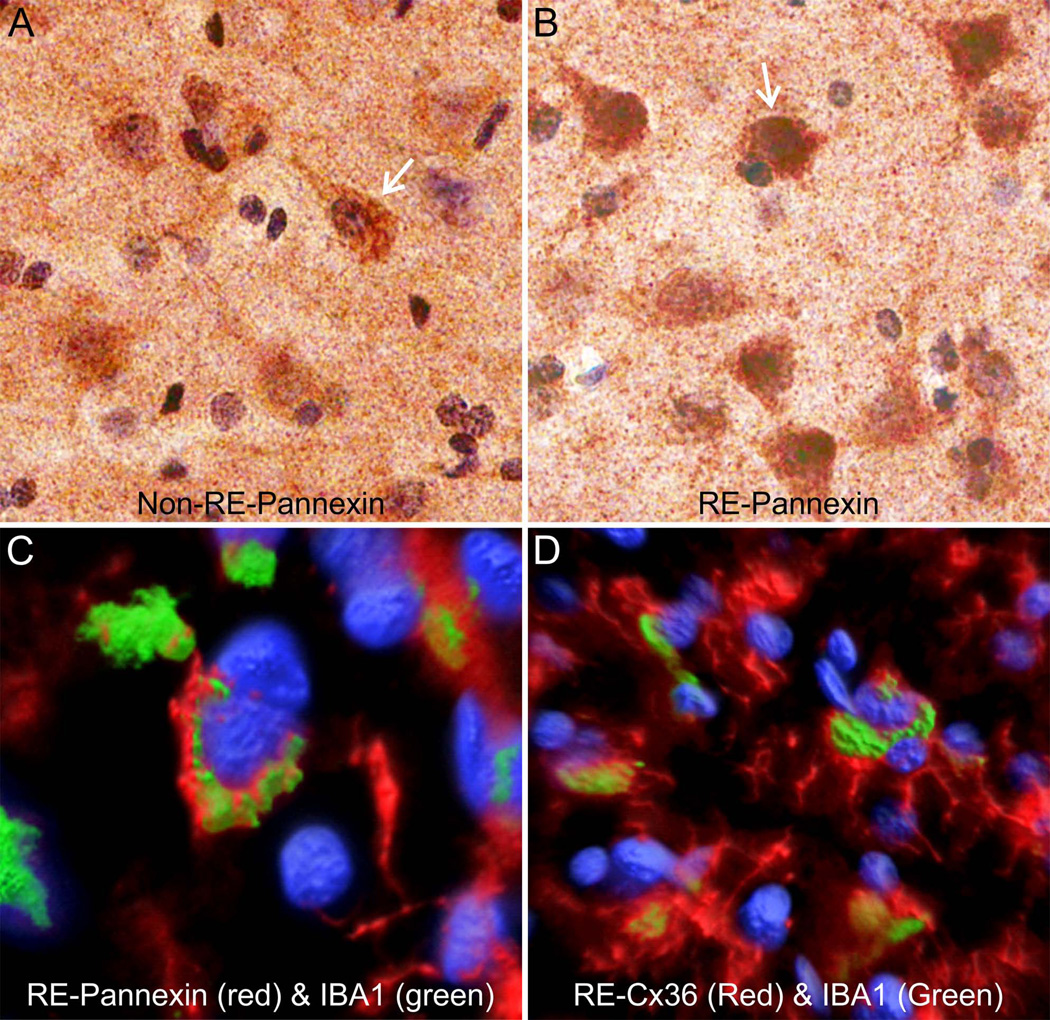
Immunostaining for pannexin in representative non-RE (A) and RE (B) cortical specimens, and double-labeling for pannexin and IBA1 (C) and Cx36 and IBA1 (D) in RE tissue. A and B. Staining against pannexin was localized to the cell bodies of pyramidal-shaped cells, and was denser in RE compared with the non-RE case. C. Double-labeling of pannexin (red) and IBA1 (green; microglia) showed overlap supporting that areas of microglial activation were associated with pannexin expression in RE. Blue fluorescence is from DAPI staining. D. Double-labeling of Cx36 with IBA1 showed similar overlap as with pannexin.

