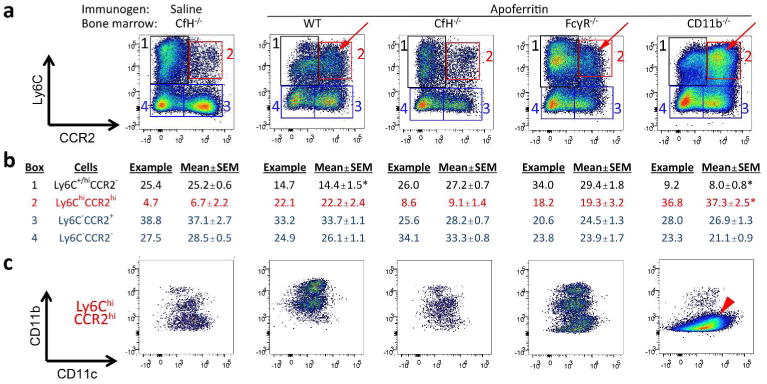
Figure 4. Characterization of F4/80+ cells in the tubulointerstitium of kidneys from CfH-/- mice chimeric for wildtype (WT), CfH-/-, FcγR-/-, and CD11b-/- bone marrow immunized for 5 weeks with apoferritin, or saline as control.

(a) Representative data for Ly6C (y-axis) and CCR2 (x-axis). The four quadrants are boxed and numbered; the percentage each group comprises of total F4/80+ cells from the representative graphs is provided in tabular form in b (in the columns “Example”). Data from all animal kidneys are also provided as “Mean ± SEM” in the adjacent columns. *P < 0.01 vs. all other groups (one-way ANOVA followed by Tukey all-pairwise testing). (c) Ly6ChiCCR2hi M1 macrophages (quadrant 2, red arrows) were analyzed for CD11c (y-axis) and CD11b (x-axis) staining. The red arrowhead depicts Ly6ChiCCR2hiCD11c+CD11b- cells in CD11b-/- chimeras.
