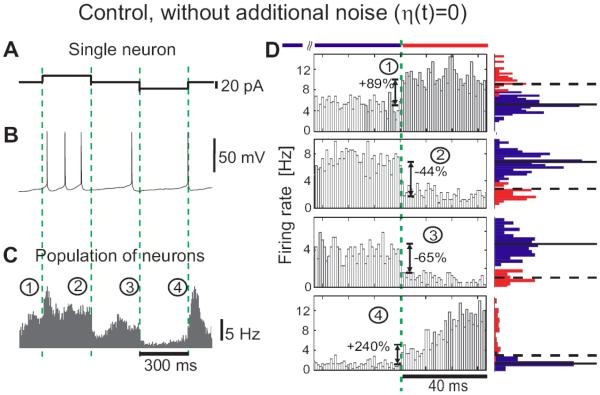
Figure 2.
Encoding of current steps by single neurons and populations in vitro under minimal noise conditions. (A) Current steps, (B) an example of membrane potential response to current in (A). (C) Population response to current steps with intrinsic noise only (η (t)=0) pooled from all 11 cells (~81 min; ~ 24380 spikes); bin size 1ms. (D) Zoom-in of responses from C. Red and blue histograms show distributions of spike counts in bins 120ms before (blue) and 40ms after each step (red), as indicated by the red and blue horizontal bars. In the distributions before the step horizontal lines show the mean rate (solid) and 3 standard deviations (dashed). Dashed green lines in A–D indicate the step onset, same notation as in Figure 1.

