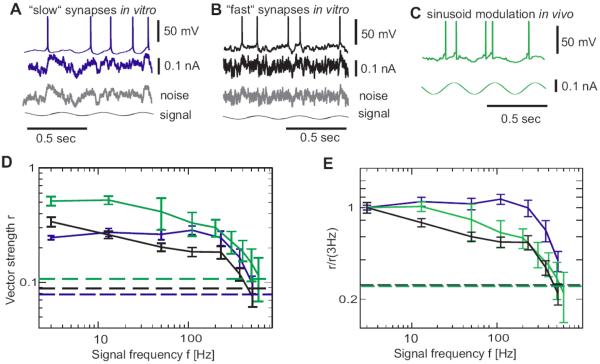
Figure 4.
Frequency encoding in neocortical neurons (A,B) Responses of L2/3 neurons in vitro to fluctuating current with periodically modulated mean and long correlation time τI = 50ms, (A, “slow synapses”, blue) or short correlation time τI = 5ms (B, “fast synapses”, black). Bottom gray traces show the corresponding fluctuating component and the signal. In A–C injected current is shown below each trace. (C) Response of a cat visual cortical neuron in vivo to sinusoidal current injection (green). (D) Frequency dependence of vector strength r for modulation paradigms in A–C (same color code), dashed horizontal lines indicate the corresponding single cell 95% significance level. For each frequency f, the vector strength r was first computed using all recordings from each recorded cell and subsequently averaged across cells. (E) Data from (D) displayed as normalized vector strength r/r(3Hz).

