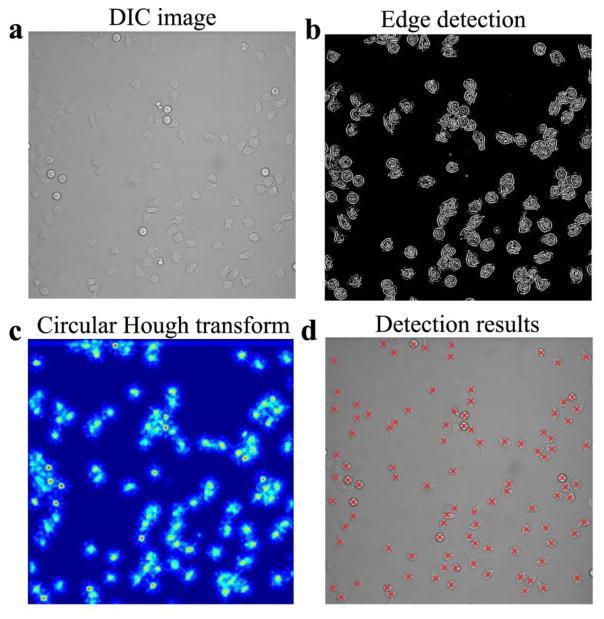
Figure 2.
Detection and tracking of cells by TIAM. TIAM uses transmitted light images for detecting and tracking cells. Illustration of detection by TIAM is provided with an example (a–d). A DIC image of human primary CD8 T cells is used (a). The panels, b to d, represent sequential stages during cell detection. In the first step, the Canny edge filter is applied to generate a binary image of cell boundaries (b). Then, a circular Hough transform (CHT) is applied to this binary image. This transform maps cell outlines to points in a parameter space based on a voting scheme (c). Local maxima in the parameter space are used to pick centroids of cells (d). TIAM has a graphical user interface that walks the user through the choice of parameters for edge filtering and CHT to allow for accurate detection of cells.

