
Figure 4.
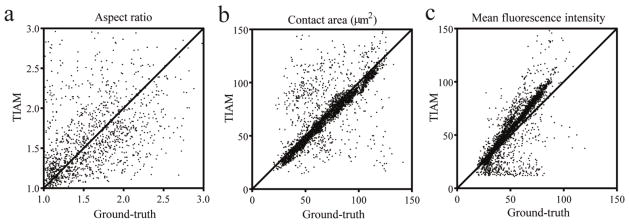
Evaluation of performance of extracting features from DIC (a), reflection (b) and fluorescence images (c). Aspect ratio (readout of morphological polarity), contact area, and mean fluorescence intensity were measured from DIC, reflection and fluorescence channels, respectively. Outlines were drawn along cell-boundaries in either a manual or semiautomated manner using ImageJ to establish the ground truth for respective channels. Performance of extracting features was evaluated by quantitative comparisons with the ground truth after establishing one-to-one pairing between TIAM results and the respective ground truth. The measured values for each pair are plotted: 1389 for DIC, 4005 for reflection and 5973 for fluorescence. Overall, the data hovered around the diagonal line implying reasonable accuracy for measurement of polarity from DIC and good accuracy for measurement of contact area and fluorescence intensity from reflection and fluorescence channels, respectively.