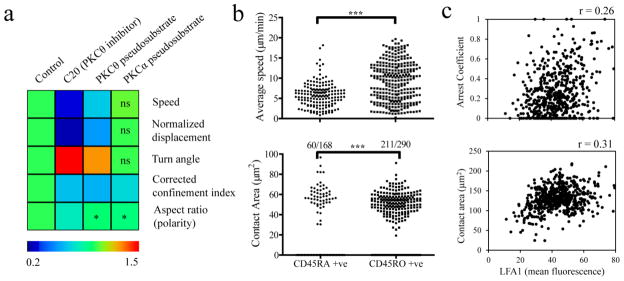
Figure 5.

Examples of integrated analysis of human CD8 T cell motility enabled by TIAM. a) Effects of pharmacological inhibitors of PKCs on CCL21 driven chemokinesis in CD45RA+ve cells. Population median values of different motility characteristics from mean values of individual cell tracks were calculated first. These have been normalized to the median motility characteristics in the ‘control’ data and shown in a colored heat map. Statistical significance of differences in the population was calculated. Unless specified otherwise in the heat map cell, p-value was below 0.0001. b) Average speed and average contact area of CD45RA+ve and CD45RO+ve cells subjected to CCL21 driven chemokinesis is shown. The number of tracks that had reflection footprint out of the total tracked cells is given for both subsets. Even when the reflection footprint existed in a portion of the track, it was counted as a cell track with attachment. The motility experiments were conducted with a mixed population wherein the subsets were isolated, loaded with different vital dyes and then mixed in equal ratio. Statistical significance was assessed by Mann-Whitney U-test in both (a) and (b). c) Average surface density of LFA1 (measured by binding of Alexa Fluor 488 labeled Fab fragment of TS2/4 non-blocking antibody) is plotted against average contact area and arrest coefficient for individual CD45RA+ve cell tracks. Pearson correlation coefficient values are shown at the top of the plots. Arrest coefficient was calculated based on a threshold instantaneous speed of 0.5 μm/min. All results are representative of two or more independent sets of experiments.
