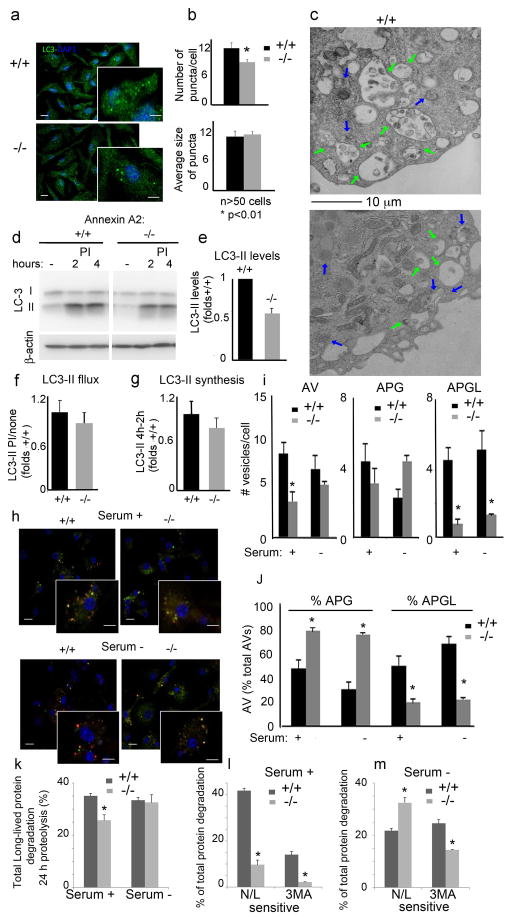
Figure 5. Reduced autophagosome biogenesis and autophagic flux in DC from Anxa2−/− mice.
a) Immunofluorescence for LC3 in dendritic cells of Anxa2+/+ and Anxa2−/− mice. Nuclei are highlighted with DAPI. Insert shows higher magnification. Scale Bars: 10 μm and 5 μm (insert) b) Quantification of the number of puncta per cell, and average size of LC3-positive puncta, in micrographs such as shown in (a); mean and standard error were calculated from n>75 cells; * p < 0.05 c) Electron microscopy of the same cells. Arrows mark autophagosomes (blue) and autolysosomes (green). Scale bar: 10 μm d) Immunoblot for LC3 in Anxa2+/+ and Anxa2−/− dendritic cells untreated (none) or incubated with lysosomal protease inhibitors (PI) for the indicated times. Actin is shown as loading control. e-g) Quantification of steady state levels of LC3-II (e), increase in LC3-II levels upon lysosomal proteolysis blockage (f) and increase in LC3-II at the two times of PI treatment (g) calculated from immunoblots shown in d. n= 3. h) Direct fluorescence microscopy in Anxa2+/+ and Anxa2−/− dendritic cells transiently transfected with the tandem reporter mCherry-GFP-LC3, and maintained in serum-supplemented or serum-depleted medium for 6 h. Inserts show higher magnification images. Scale bars: 10 μm and 5 μm (insert). i) Quantification of the number of total autophagic vacuoles (AV; mCherry+). Autophagosome (APG, mCherry+ and GFP+) and autolysosomes (APGL, mCherry+ and GFP−) in images such as in (h); mean and standard error were calculated from n>75 cells; * p < 0.05 j) Quantification of the percentage of autophagosomes and autolysosomes; * p < 0.05 k–m) Rates of degradation of long-lived proteins in Anxa2+/+ and Anxa2−/− dendritic cells maintained in the presence or absence of serum for 24 h. Total rates of protein degradation (k), and degradation sensitive to lysosomal inhibition (combination of ammonium chloride and leupeptin (N/L)) or to inhibition of macroautophagy (3-methyl adenine (3MA)), in cells maintained in the presence (l) or absence (m) of serum. n = 6; * p < 0.05 (all unpaired two-tailed Student’s t-test).

