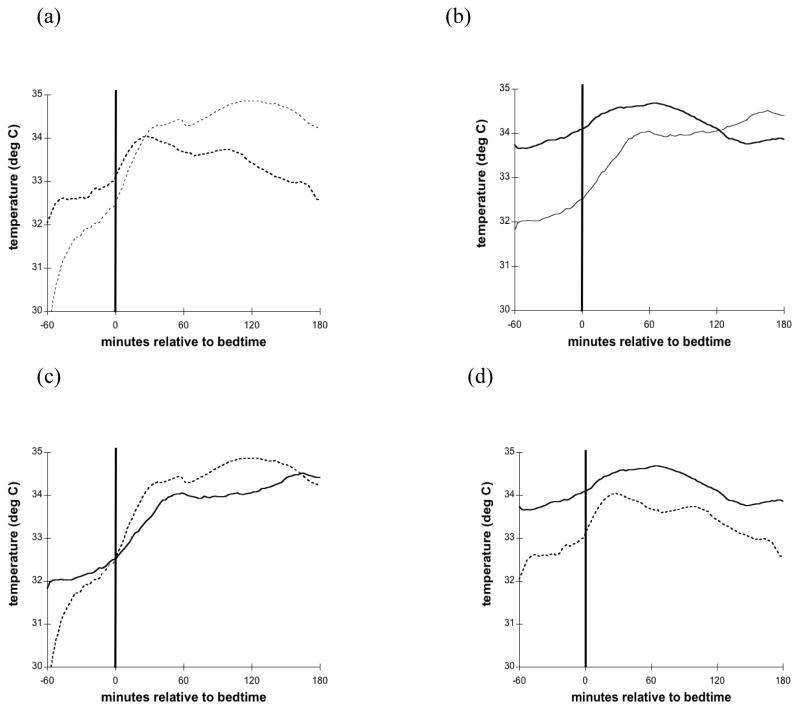
Figure 2.
Skin temperature relative to Bedtime. Smoothed curves from group averages of distal and proximal temperature from the 60 minutes before until 180 minutes after Bedtime; (a) Control (thin dotted line = distal; thick dotted line = proximal), (b) FOH (thin solid line = distal; thick solid line = proximal), (c) Control vs FOH distal (dotted line = Control; solid line = FOH), (d) Control vs FOH Proximal (dotted line = Control; solid line = FOH).

