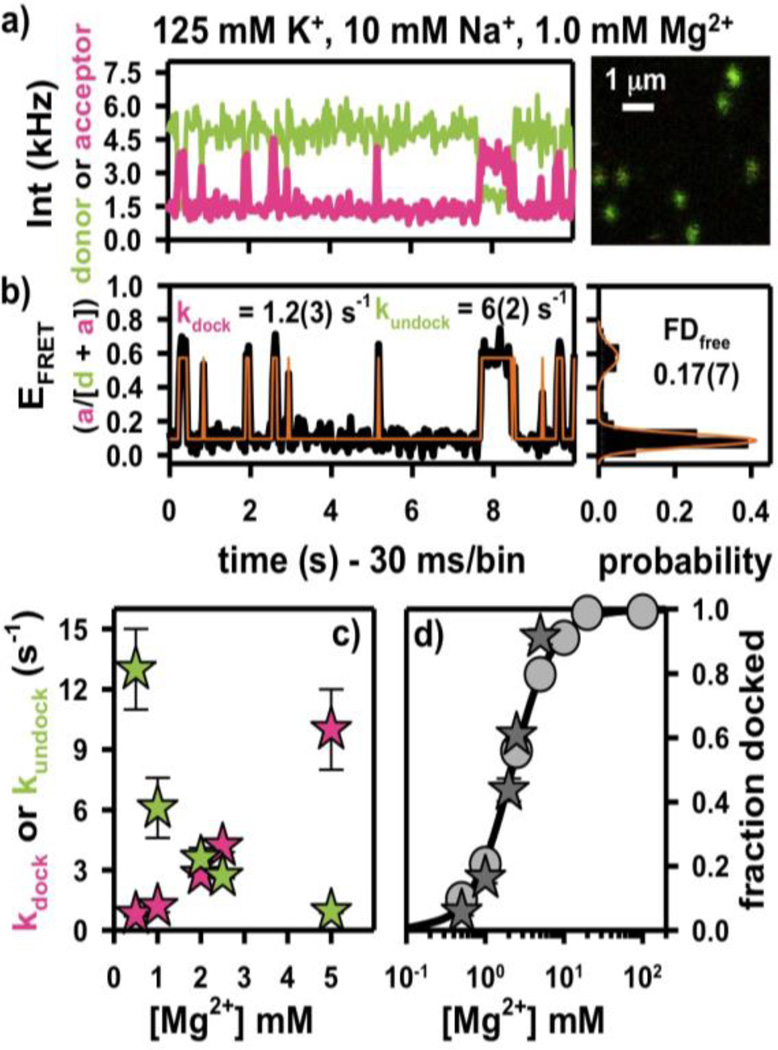
Figure 6.
Kissing-loop docking kinetics in the absence of bound ligand. Representative a) fluorescence and b) FRET time-traces from a surface immobilized env8HyCbl riboswitch. Orange line represents the maximum-likelihood 2-state Bayesian model that bests describes the data c) The docking and undocking rate constants, as a function of [Mg2+], are used to calculate the fractional occupancy of the docked conformation d) in the absence of HyCbl (FDfree), which reveals that the surface immobilized results (dark grey stars) are in quantitative agreement with the freely diffusing experiments (light grey circles). The error bars are often smaller than the symbols used for each data (Materials and Methods).

