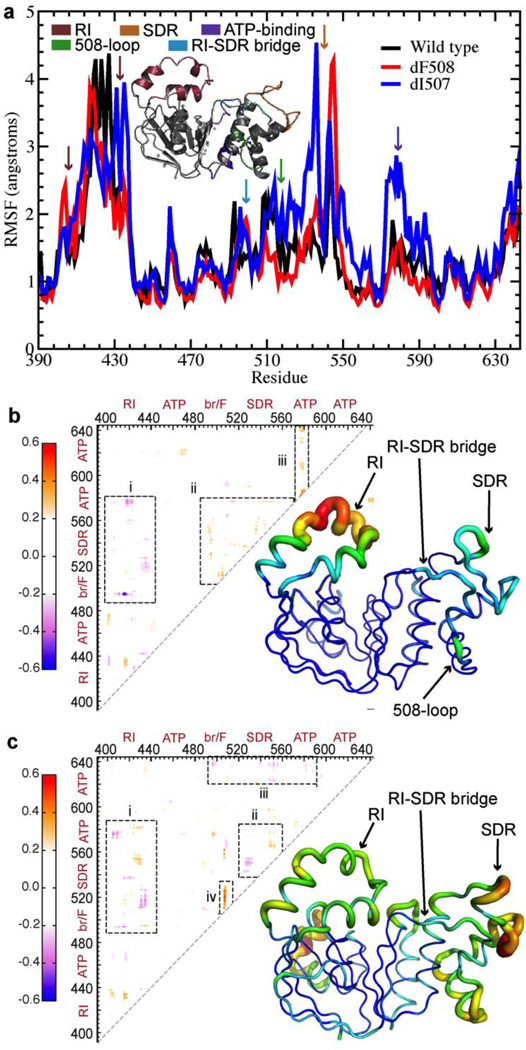
Figure 1.
Deletion of F508 or I507 results in altered coupling between regions of NBD1. (a) The root mean square fluctuations (RMSF) over the simulation of each residue in WT NBD1 compared with those in ΔF508- and ΔI507-NBD1 suggests increased flexibility in several regions upon deletion mutation. (b) Difference map derived from the correlation maps of WT and ΔF508 NBD1. Blue denotes lost correlation upon deletion mutation, while red denotes gained correlation. Tube representation of NBD1 protein dynamics highlights changes in fluctuations in NBD1 upon deletion of F508. The thickness and color of the tube represent the extent of change in dynamics of the corresponding region during the simulation. Warmer colors indicate greater increase in flexibility, while colder colors indicate no change. (c) Same as (b), for ΔI507-NBD1.

