Figure 7.

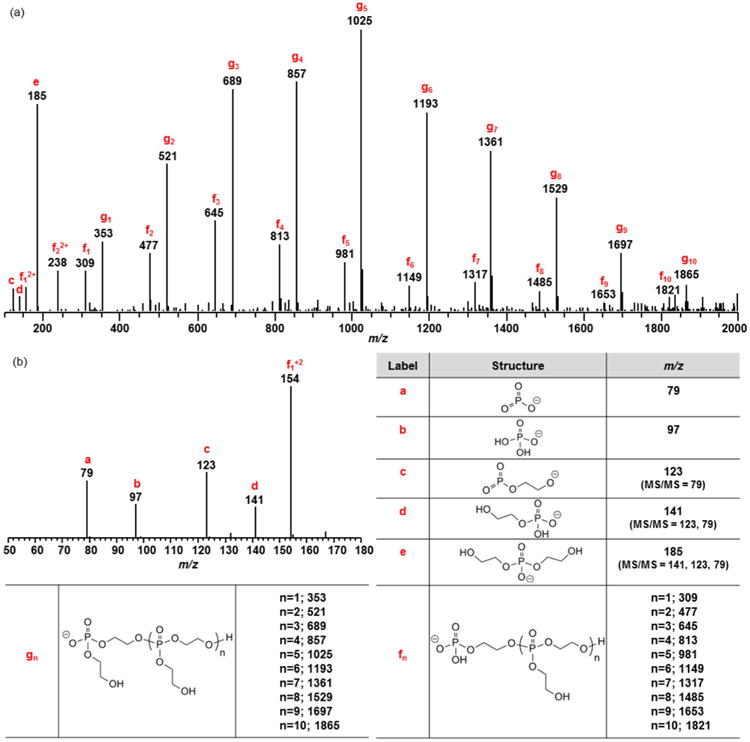
ESI MS analysis of the degradation products of 8. Mass spectra in negative ion mode; m/z range of 100–2000 (a) and 50–180 (b). See Figures S5 and S6 for MS/MS spectra of f1 and g1.

ESI MS analysis of the degradation products of 8. Mass spectra in negative ion mode; m/z range of 100–2000 (a) and 50–180 (b). See Figures S5 and S6 for MS/MS spectra of f1 and g1.