
Figure 2.
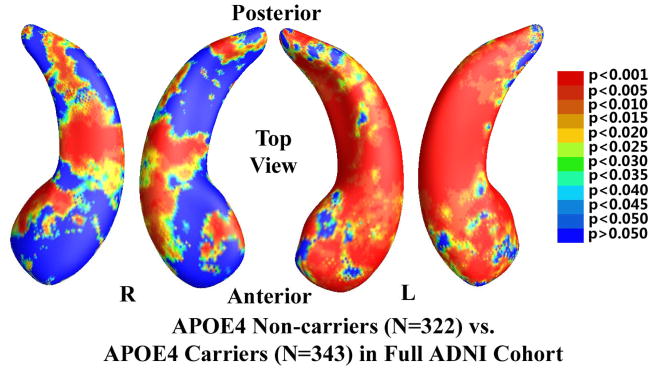
Illustration of local shape differences (P values) between the APOE e4 noncarriers (e3/e3, N = 322) and carriers (e3/e4 and e4/e4, N = 343) in the full ADNI cohort. Nonblue colors show vertices with statistical differences, at the nomial 0.05 level, uncorrected. The overall significance after multiple comparisons with permutation test is P < 0.0002.