
Figure 3.
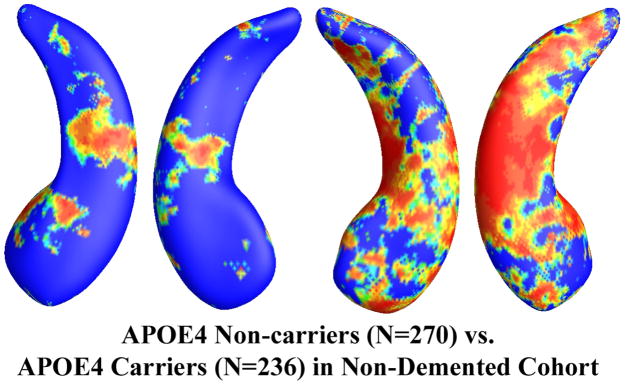
Illustration of local shape differences (P values; a) between the APOE e4 noncarriers (e3/e3, N = 270) and carriers (e3/e4 and e4/e4, N = 236) in the non-demented cohort (MCI and controls). Nonblue colors show vertices with statistical differences, at the nomial 0.05 level, uncorrected. The overall significance after multiple comparisons with permutation test is P < 0.0027.