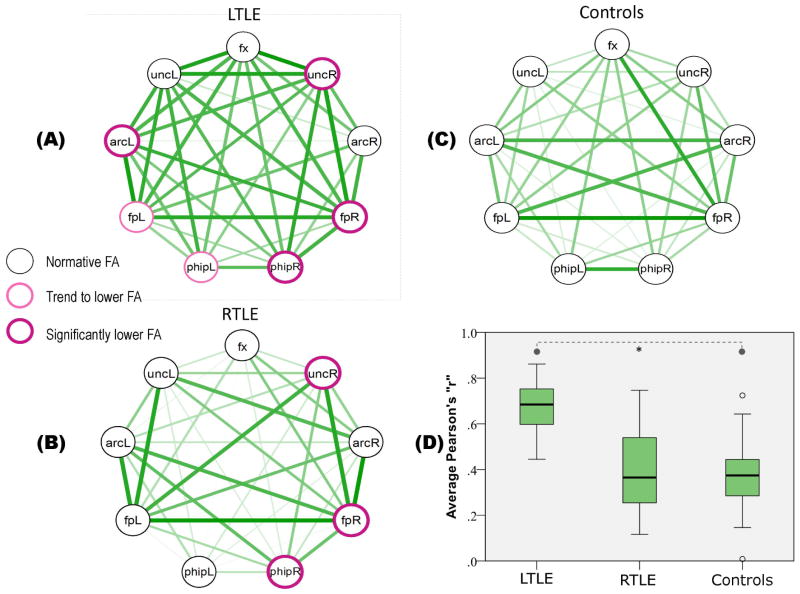
Figure 2.
Nine tracts (nodes) and their correlations (edges) in LTLE (panel A), RTLE (panel B) and Controls (panel C). The border thickness and color of the nodes indicate departures from normality in the TLE groups. Edge color saturation and thickness reflect the correlation strength among tracts (Pearson “r”). Panel D shows a plot of correlations in each group; the boxes span between 25th and 75th percentile, the thick black line within the box convey the median value, and the T-bars extend 1.5 times the height of the box. Data points outside these ranges are depicted as circles. Tract abbreviations: fx=fornix, unc=uncinate, arc=arcuate, fp=frontoparietal, phip=parahippocampal.

