
Fig. 3.
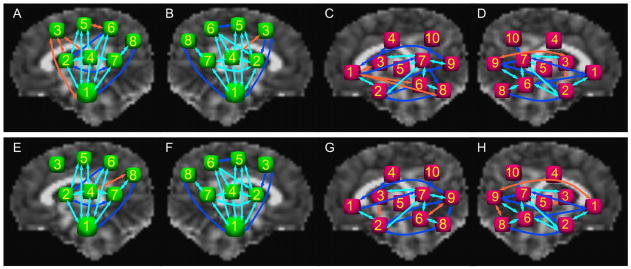
Schematic representation and comparison of WM-ROI connections found among target ROIs in the majority of subjects in the HC and PAE groups for the projection and association networks. R-PROJ, L-PROJ, R-ASSOC and L-ASSOC are shown for HC in panels A–D, respectively, and for PAE in panels E–H. Arrows in light blue represent connections for all subjects in both groups; in dark blue, for connections in at least 80% of subjects in both groups; in orange, for at least 80% of subjects in one group but not the other.