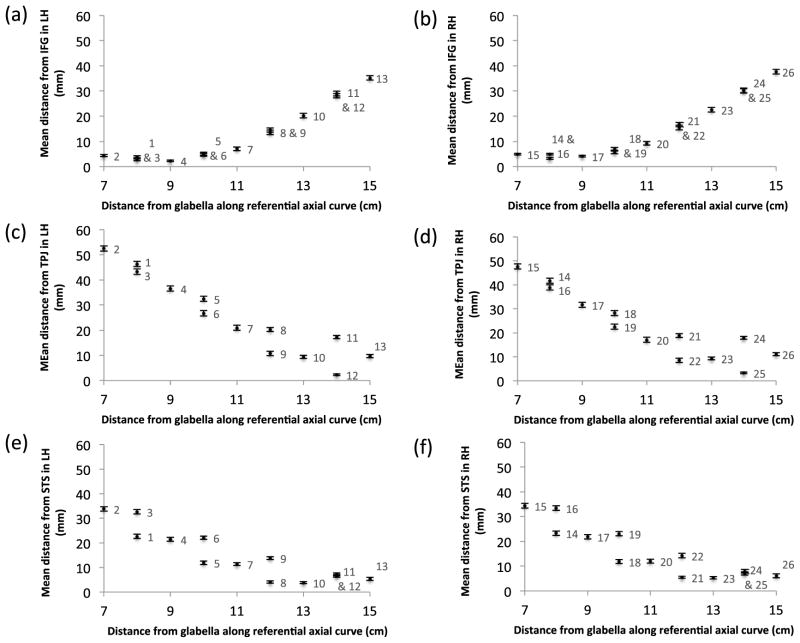
Fig. 6.
The median distance of each channel from each ROI (IFG, TPJ, STS) plotted in relation to the distance of the fNIRS channel from the glabella in the axial plane. The channel numbers are labeled on each plot. Standard error bars showing the interindividual differences are included, however as the maximum SE was 1.41 mm, they may not be clear for some data points.

