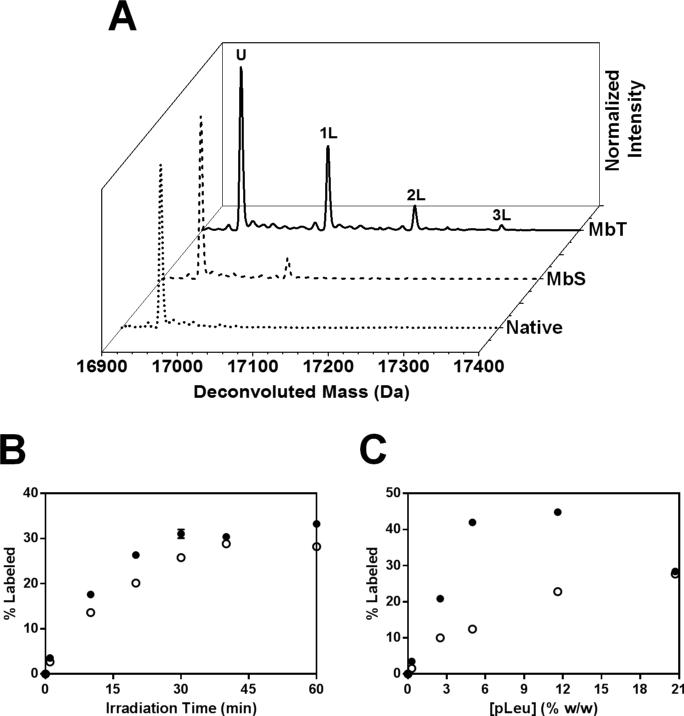
Figure 6. ssPL-MS for intact Mb.
(A) Deconvoluted mass spectra for MbT (solid line) and MbS (dashed line) labeled with 20x excess (5 % w/w) pLeu. Deconvoluted mass spectrum of native Mb (Mb lyophilized and irradiated in the absence of pLeu) is shown as the dotted line. U denotes a population of protein that remains unlabeled after irradiation. Populations of protein carrying 1, 2 and 3 pLeu labels are represented as 1L, 2L and 3L respectively. (B) ssPL-MS kinetics for intact Mb in formulations MbT (closed circles) and MbS (open circles) as a function of pLeu concentration. All samples were irradiated for 40 min. Error bars are within the symbols. (C) ssPL-MS kinetics for intact Mb in formulations MbT (closed circles) and MbS (open circles) lyophilized and irradiated in the presence of 100x excess pLeu (20.7 % w/w) as a function of irradiation time. Error bars are within the symbols.

