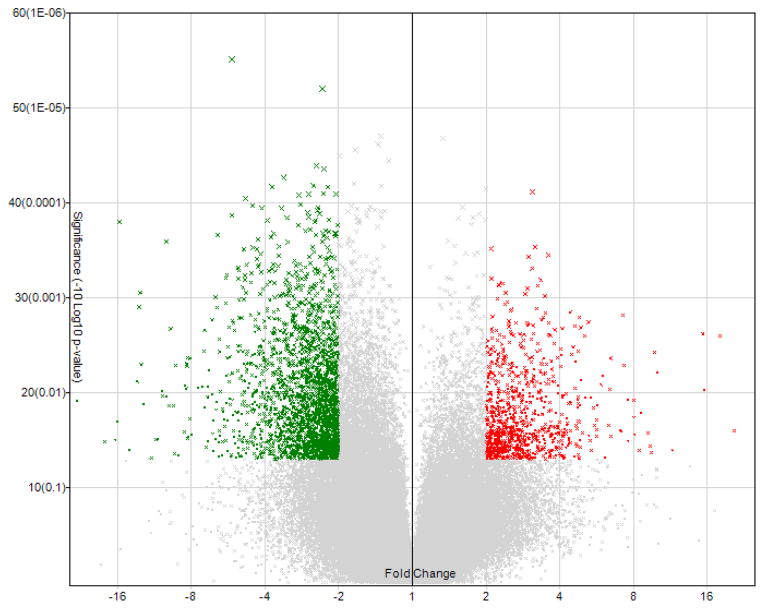
Fig. 3.
Volcano plots showing the distribution of gene expression fold changes and p-values. A total of 129,542 genes in the extended gene category were tested. Genes with fold change > 2 and p-value < 0.05 (900 genes) are indicated in red, and genes with fold change < −2 and p-value < 0.05 (2,511 genes) are indicated in green.

