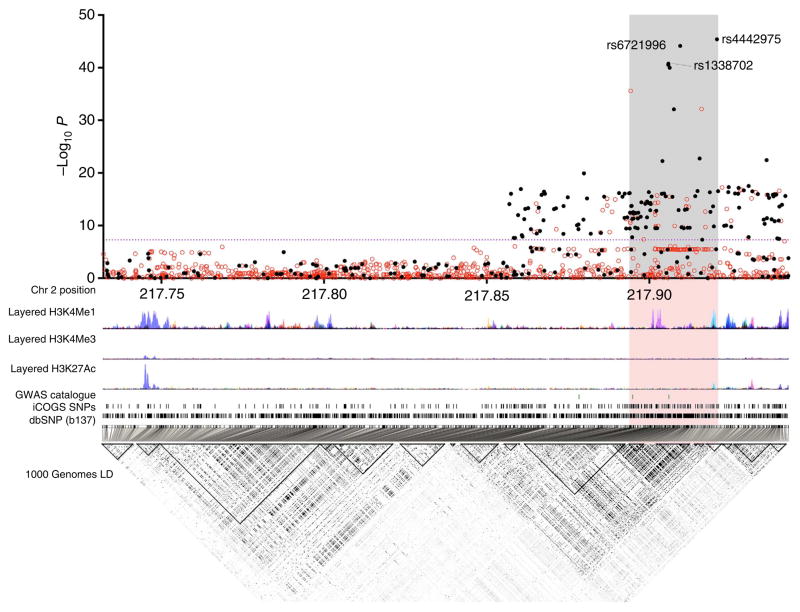
Figure 1. Genetic mapping and epigenetic landscape at the 2q35 locus.
Manhattan plot of the 2q35 breast cancer susceptibility locus. Genotyped (black dots) and imputed (red dots) SNPs are plotted based on their chromosomal position on the x axis and their overall P values (log10 values, likelihood ratio test) from the European BCAC studies (46,451 cases and 42,599 controls) on the y axis. The shaded region represents an area bounded by SNPs correlated with rs4442975 at r2 = 0.8. Data from the UCSC Genome Browser, including epigenetic marks for methylation of histone H3 at lysine 4 (H3K4me1, H3K4me3) and acetylation of H3 at lysine 27 (H3K27ac) in seven cell types from ENCODE28. The positions of all analysed iCOGS SNPs are marked. LD, using data from the BCAC population, is depicted beneath—white represents r2 = 0 and black r2 = 1.

