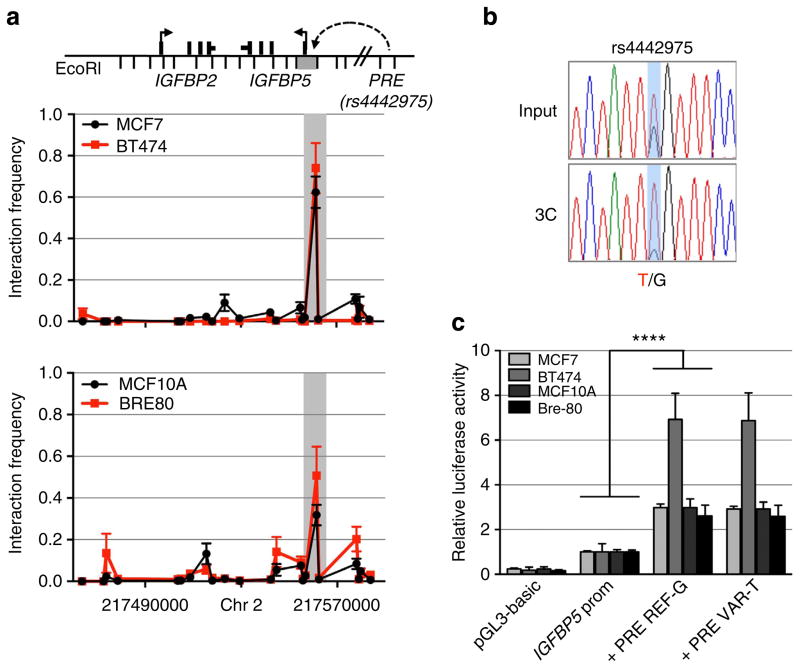
Figure 3. Chromatin interactions at the 2q35 risk region with IGFBP5 in breast cell lines.
(a) 3C interaction profiles between the PRE (containing rs4442975) and the IGFBP5 promoter region (grey box). 3C libraries were generated with EcoRI, with the anchor point set at the PRE. A physical map of the region interrogated by 3C is shown above, with the grey bar representing the position of the IGFBP5 promoter (not to scale). Graphs represent three biological replicates assayed in duplicate. Error bars denote s.d. (b) 3C followed by sequencing for the rs4442975-containing region in heterozygous BT474 breast cancer cells shows allele-specific chromatin looping. Chromatograms represent one of the three independent 3C libraries generated and sequenced. (c) Luciferase reporter assays in breast cell lines demonstrating enhancer activity of the PRE at the 2q35 risk locus. The PRE was cloned upstream of an IGFBP5 promoter-driven luciferase reporter with and without SNP rs4442975. Cells were transiently transfected with each of these constructs and assayed for luciferase activity after 24 h. Graphs represent two independent experiments assayed in triplicate. Error bars denote s.d. P values were determined with a two-tailed t-test. ****P<0.0001.

