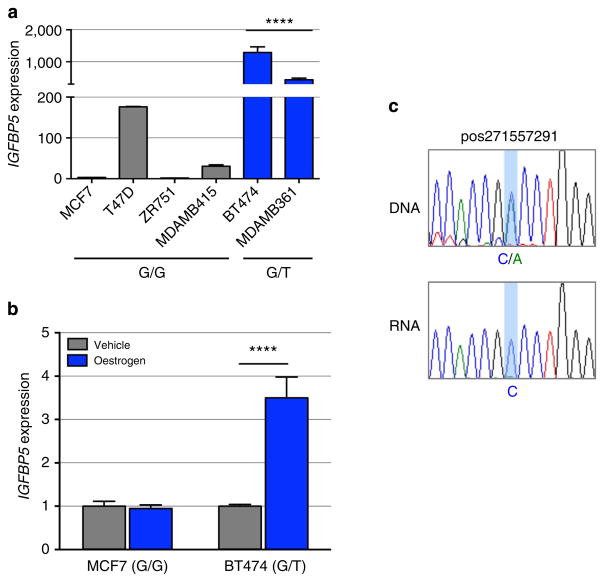
Figure 4. IGFBP5 expression in breast cancer cell lines and normal breast tissue.
(a) Endogenous IGFBP5 expression measured by qPCR in untreated ER + human breast cancer cell lines and (b) oestrogen-stimulated breast cancer cell lines. Graphs represent three independent experiments. Error bars denote s.e.m. P values were determined by a two-tailed t-test. ****P<0.0001. (c) Allele-specific IGFBP5 expression measured by allelic amplification of intronic marker variant pos271557291. Chromatograms represent one of the three independent experiments performed and sequenced.

