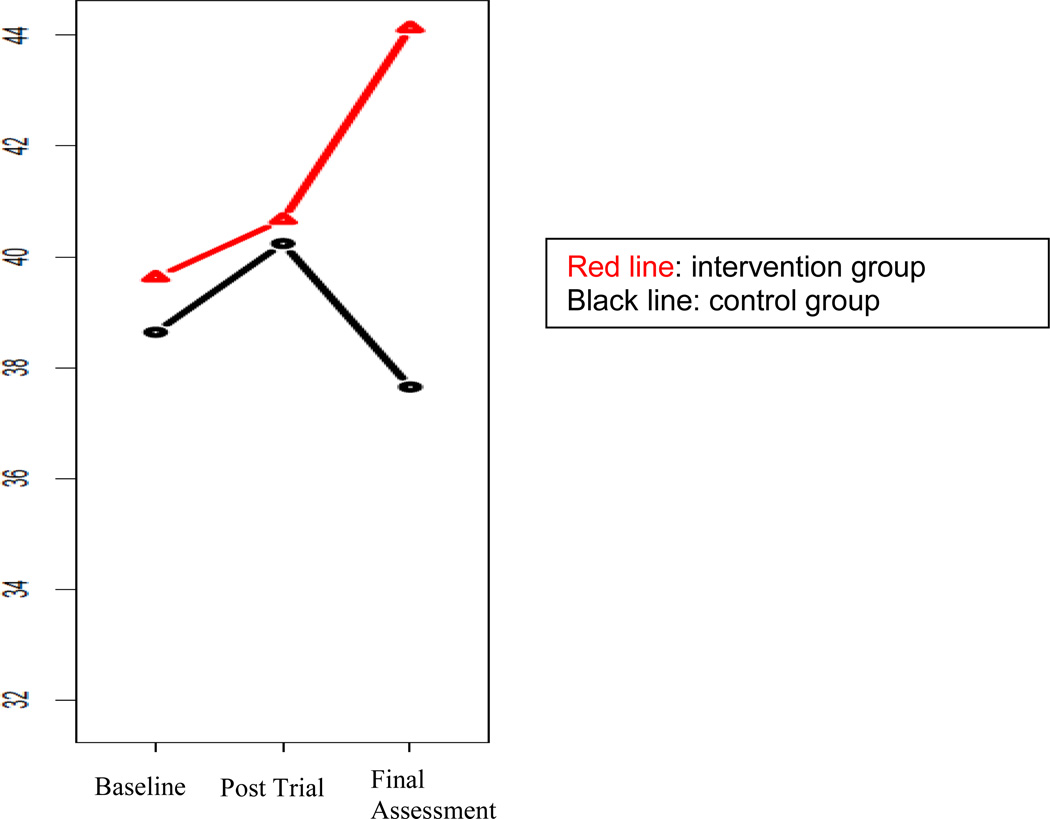
Figure 2.
Letter Fluency Test Results at Baseline, Post-Trial and Final Assessments among CDR=0 Group
Note: The figure shows that among the CDR=0 group, the intervention group kept improving the test score after the trial, but the control group experienced decline at the final assessment, leading to a significant difference between the two groups in the gain in scores from baseline to the final assessment (p=0.004)

