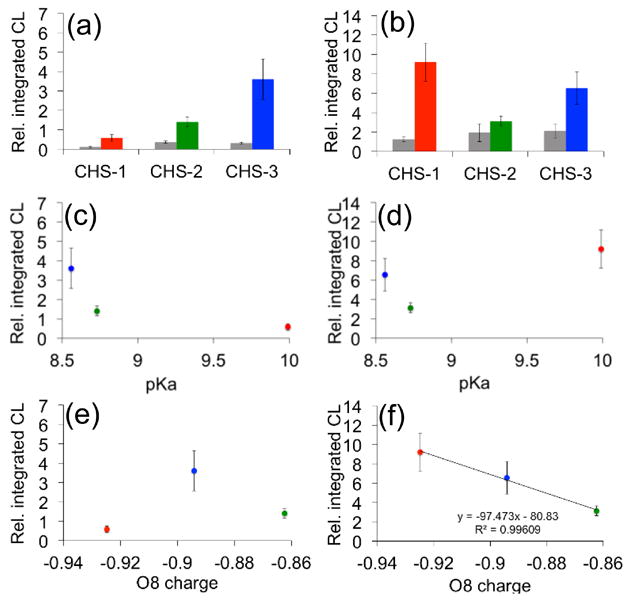
Figure 3.

Analysis of chemiluminescent responses. (a)–(b) Bar graphs for the integrated chemiluminescent emission over 10 min at (a) pH 7.4 or (b) pH 10 of CHS-1, CHS-2, and CHS-3 to 0 μM Na2S (grey bars) and 200 μM Na2S (colored bars). (c)–(d) Plot of the integrated chemiluminescent emission over 10 min at (c) pH 7.4 or (d) pH 10 of 200 μM Na2S and 40 μM CHS-1 (red), CHS-2 (green) and CHS-3 (blue) versus experimental pKa values of model compounds phenol, 2-fluorophenol, and 2-chlorophenol. (e)–(f) Plot of the integrated chemiluminescent emission over 10 min at (e) pH 7.4 or (f) pH 10 of 200 μM Na2S and 40 μM CHS-1 (red), CHS-2 (green) and CHS-3 (blue) versus the calculated atomic charge on the phenolate oxygen (O8). All luminescent measurements were acquired in 20 mM HEPES buffer (pH 7.4) or 100 mM glycine buffer (pH 10) containing 20% Emerald II Enhancer. The reported values are averages of the integrated emission intensities over 10 min (n = 4–7). Error bars represent ± S.D. The ESP atomic charges were calculated at the M06/6-311+G(d,p) level of theory using geometries optimized at the B3LYP/6-311+G(d,p) level of theory. Calculations were carried out with the IEF-PCM water solvation model using the Gaussian 09 program package.
