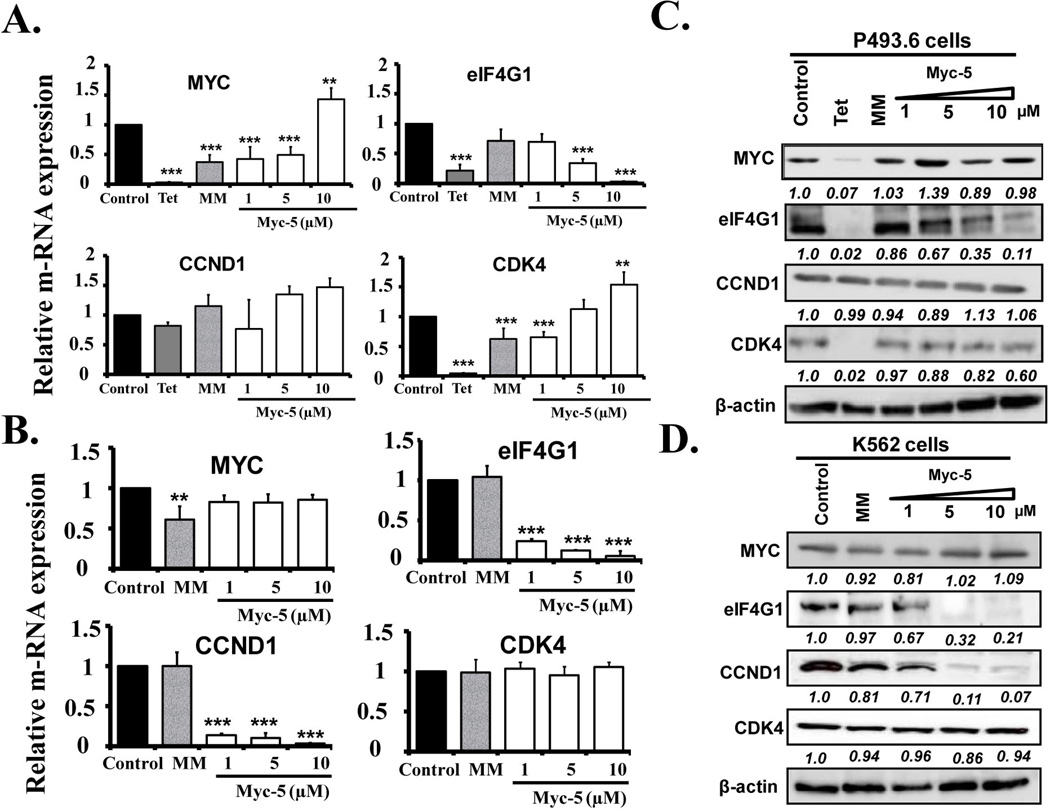
Figure 3. Myc-5 down-regulates m-RNA expression and protein expression of the target genes.
A-B, Gene expression of target gens were detected by quantitative real time PCR after 72 hour of control and treated with Myc-5 (1,5 and 10 µM conc.) and mismatch PI polyamide (MM) at 10 µM conc. and normalized with GAPDH in (A) P493.6 and (B) K562 cells. The data in A and B are shown as mean value with error bars representing ± SD. Statistical significance was calculated by Student's t test. **, p<0.05, **, p<0.001 when compared to control. C-D, P493.6 and K562 cells were treated with Myc-5 (1, 5 and 10 µM) and mismatch PI polyamide (10 µM) for 72 hours. Western blotting was performed as described in supplementary material method section. β-actin was used at loading control. The Relative band intensities in P493.6 and K562 cells was determined by dividing the intensity of the band by β-actin followed by normalization to the control.

