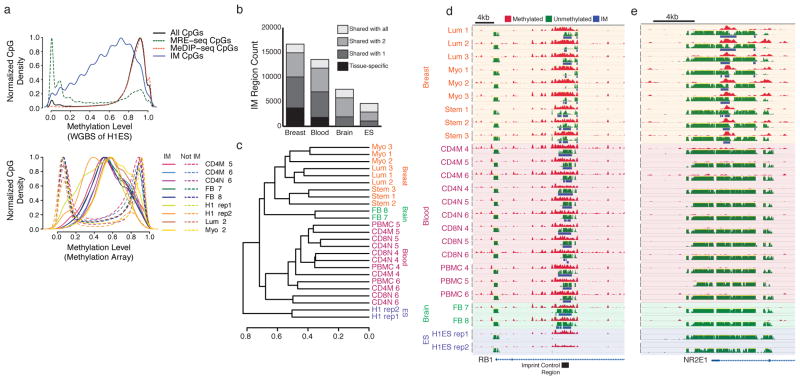
Figure 1. IM is predominantly cell type-specific.
(a) Top panel, comparison of WGBS methylation levels at CpGs carrying only MRE-seq or MeDIP-seq reads, and CpGs within IM regions. Bottom panel, comparison of 450k Infinium array methylation levels at CpGs in IM regions and outside of IM regions (66% of all IM regions overlap one or more methylation array probes). A value of 0 is unmethylated, a value of 1 is fully methylated. (b) Comparison of the number of IM regions specific to one or more of the four tissues studied. (c) Hierarchical clustering of cell type similarity based on presence or absence of IM status. Distance metric is Jaccard; clustering method is average. (d) The known imprinted locus in the body of the Rb gene was detected as IM in all tissues except ES cells using MeDIP-seq/MRE-seq. (e) A breast-specific IM region. (d–e) Height for all tracks shows a signal range from 0–50 reads.

