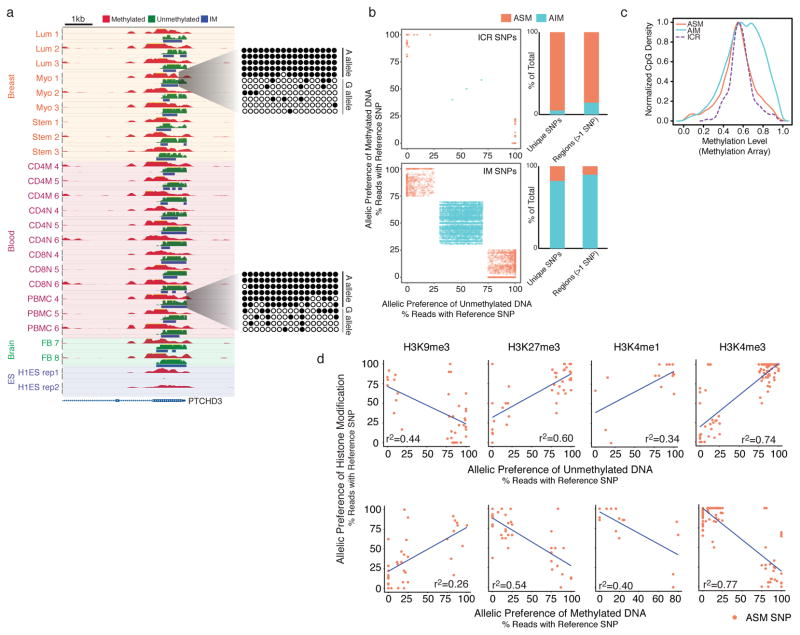
Figure 3. Characterization of ASM and AIM regions.
(a) A novel ASM region in exon 1 of PTCHD3 validated by clonal bisulfite sequencing. Height for all tracks shows a signal range from 0–50 reads. (b) Scatter plots showing separation of ASM and AIM SNPs in imprinting control regions (ICRs) and in all IM regions based on allelic preference in MeDIP-seq and MRE-seq reads. Bar graphs showing relative proportions of ASM and AIM SNPs, and proportions of whole ASM and AIM IM regions based on presence of >1 ASM or AIM SNP per region. (c) Comparison of methylation array levels between CpGs in ICRs, ASM, and AIM. A value of 0 is unmethylated, and a value of 1 is fully methylated. (d) Comparison of allelic preference between histone modifications, unmethylated DNA (MRE-seq) and methylated DNA (MeDIP-seq) at ASM SNPs from fetal brain, in which the heterozygous genotype was verified by WGS. A positive correlation indicates that signals are on the same allele, while negative correlation indicates that signals are on opposite alleles.

