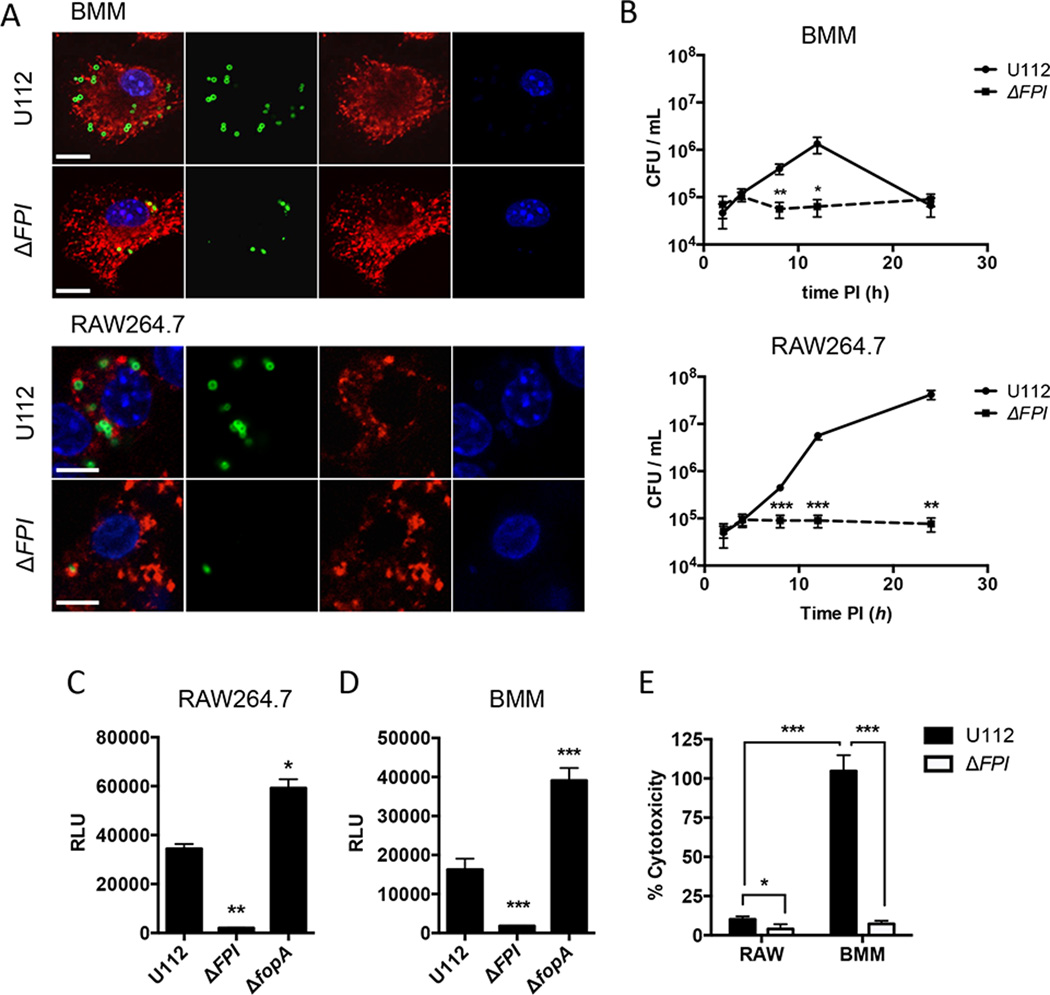
Figure 2. The type I IFN response to F. novicida is similar in BMM and RAW264.7 macrophages.
BMMs and RAW264.7 macrophages were infected with the indicated F. novicida strains at an MOI of 10. (A) Immunofluorescence microscopy of BMMs and RAW264.7 macrophages stained for F. novicida (green), LAMP-1 (red) and DAPI (blue) 8 hours post-infection. Scale bars, 10 µm. (B) Intracellular survival was assessed by CFU plating. Type I IFN levels from (C) RAW264.7 macrophages or (D) C57Bl/6 BMMs were measured 24 h and 12 h post-infection, respectively. (E) Cytotoxicity was determined by measuring LDH release 24 h post-infection. *p < 0.05, **p < 0.01, ***p < 0.001. Graphs show the mean ± standard deviation (SD) of triplicate wells and are representative of three independent experiments.

