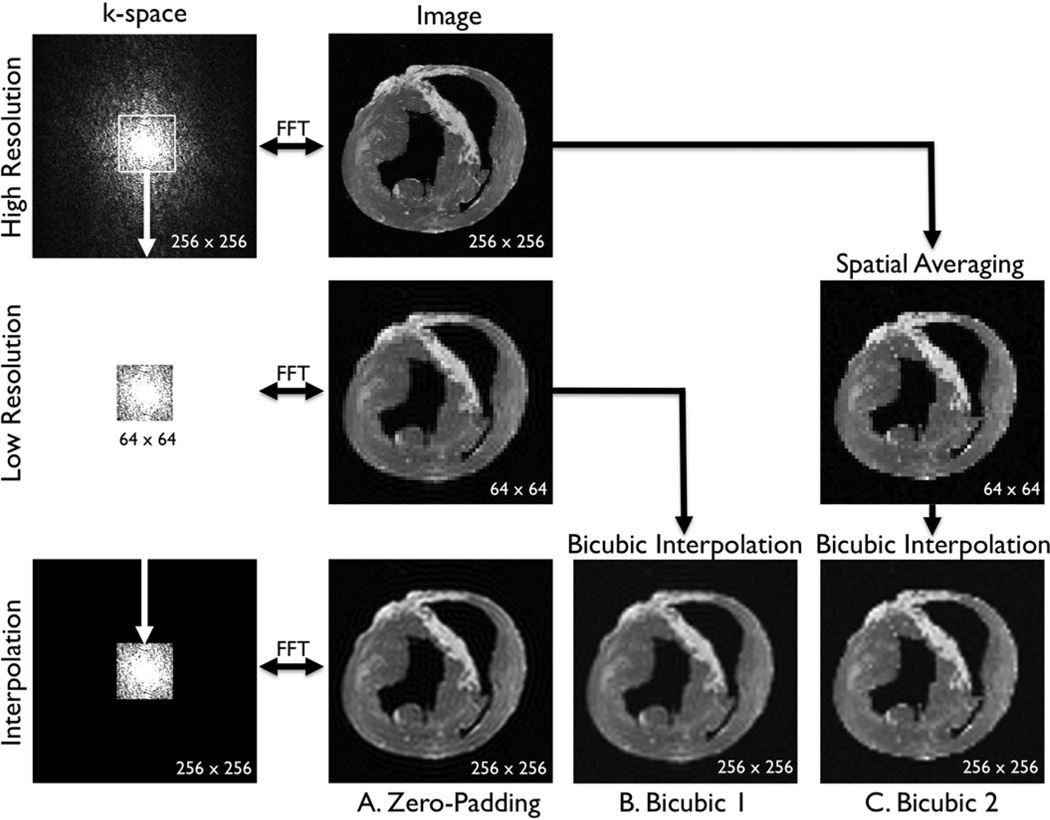
FIGURE 2.
Three comparative analyses. A. Zero-padding. A fast Fourier transform (FFT) was applied to the high-resolution image to compute the high-resolution k-space (a 256 × 256 matrix). The low-resolution k-space was created by extracting the central, low-frequency components (a 64 × 64 matrix) of the high-resolution k-space. The magnitude of the low-resolution k-space was corrected by a factor of 16 (= 4 × 4) and smoothed by a Fermi window to simulate a low-resolution acquisition. The low-resolution image (a 64 × 64 matrix) was obtained as an FFT of the low-resolution k-space. The interpolated image (a 256 × 256 matrix) was obtained by padding zeros around the low-resolution k-space to restore the original size (a 256 × 256 matrix), and by applying inverse FFT to the zero-padded k-space. This is mathematically equivalent to convolution with a sinc function. B. Bicubic 1 The low-resolution image (a 64 × 64 matrix) was created as in the zero-padding group. The interpolated image (a 256 × 256 matrix) was created by applying bicubic interpolation to the low-resolution image. C. Bicubic 2. The low-resolution image (a 64 × 64 matrix) was created by spatially averaging the high-resolution image (a 256 × 256 matrix). The interpolated image (a 256 × 256 matrix) was created by applying bicubic interpolation to the low-resolution image.

