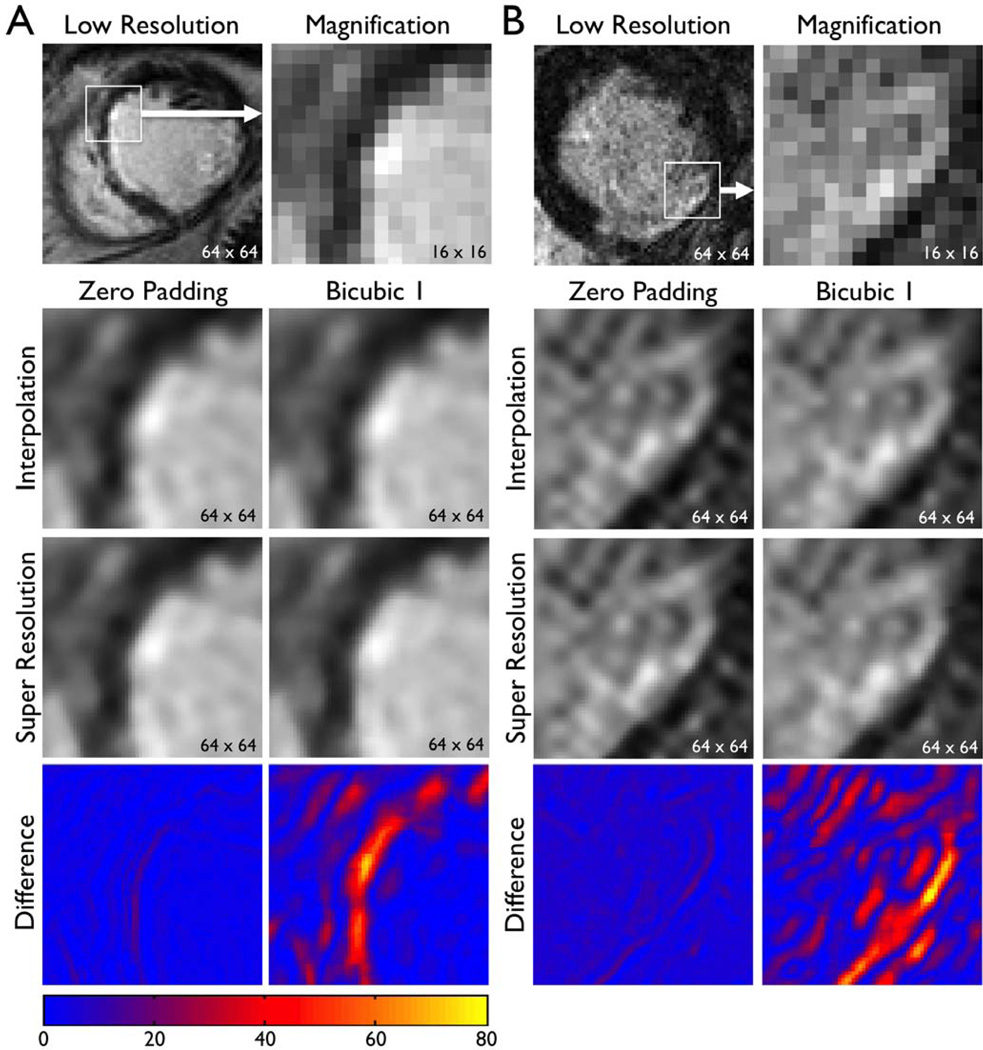
FIGURE 6.
Super resolution applied to patient images: short-axis images. Original, low-resolution images of patients A and B with clinical standard spatial resolution were interpolated (zero padding or Bicubic 1) to scale up by a factor of 4. Super resolution was applied to the interpolated image. The bottom row represents the absolute difference in SI between the interpolated image and the super resolution image, as in Fig. 3. Note sharper geometric features in super resolution images (e.g. edges, endocardial border with blood pool).

