Fig. 2.
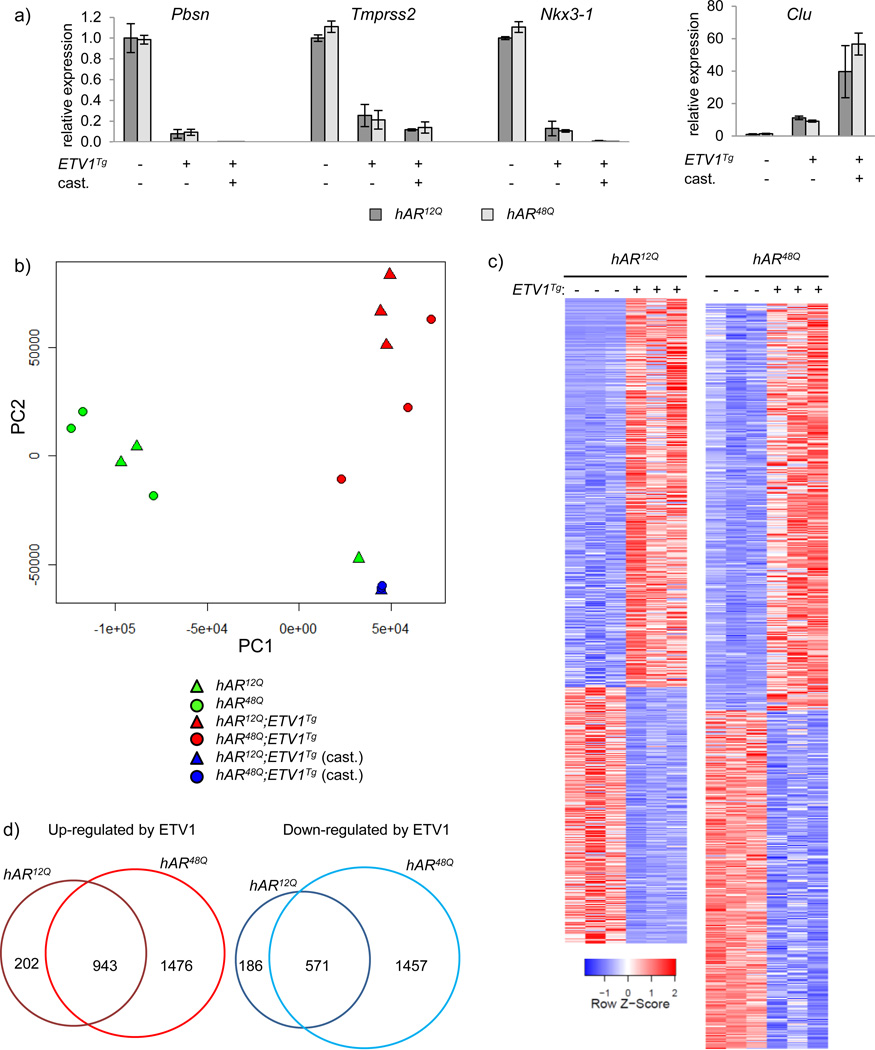
ETV1 overexpression alters prostatic gene expression a 2 unique pools of DLP RNA from each group were analyzed by qRT-PCR. Expression of the AR target genes Pbsn, Tmprss2, Nkx3-1 and Clu was normalized to Actb expression and plotted relative to the intact hAR12Q group using the 2−ddCt method. Mean +/− SEM are plotted. b Principal component analysis was performed for all genes among the 16 individual RNA-seq libraries. hAR12Q and hAR48Q mice are represented as triangles and circles, respectively. Green, red and blue represent intact non-transgenic, intact transgenic and castrated transgenic mice, respectively. c RNA-seq analysis was performed on DLP RNA. Samples from intact groups were divided into 3 unique RNA pools for library construction (2 unique pools for castrated groups). Heatmaps include differentially expressed genes between the groups shown (FDR ≤ 0.05). Individual libraries are shown for differentially expressed genes among intact hAR12Q;ETV1Tg vs. hAR12Q (1145 up, 757 down) or intact hAR48Q;ETV1Tg vs. hAR48Q (2419 up, 2028 down). Red and blue represent high or low expression, respectively, relative to the mean expression level in the samples shown. Columns and rows represent samples and genes, respectively. d Overlap between genes differentially expressed in hAR12Q;ETV1Tg and hAR48Q;ETV1Tg is illustrated by Venn diagram.

