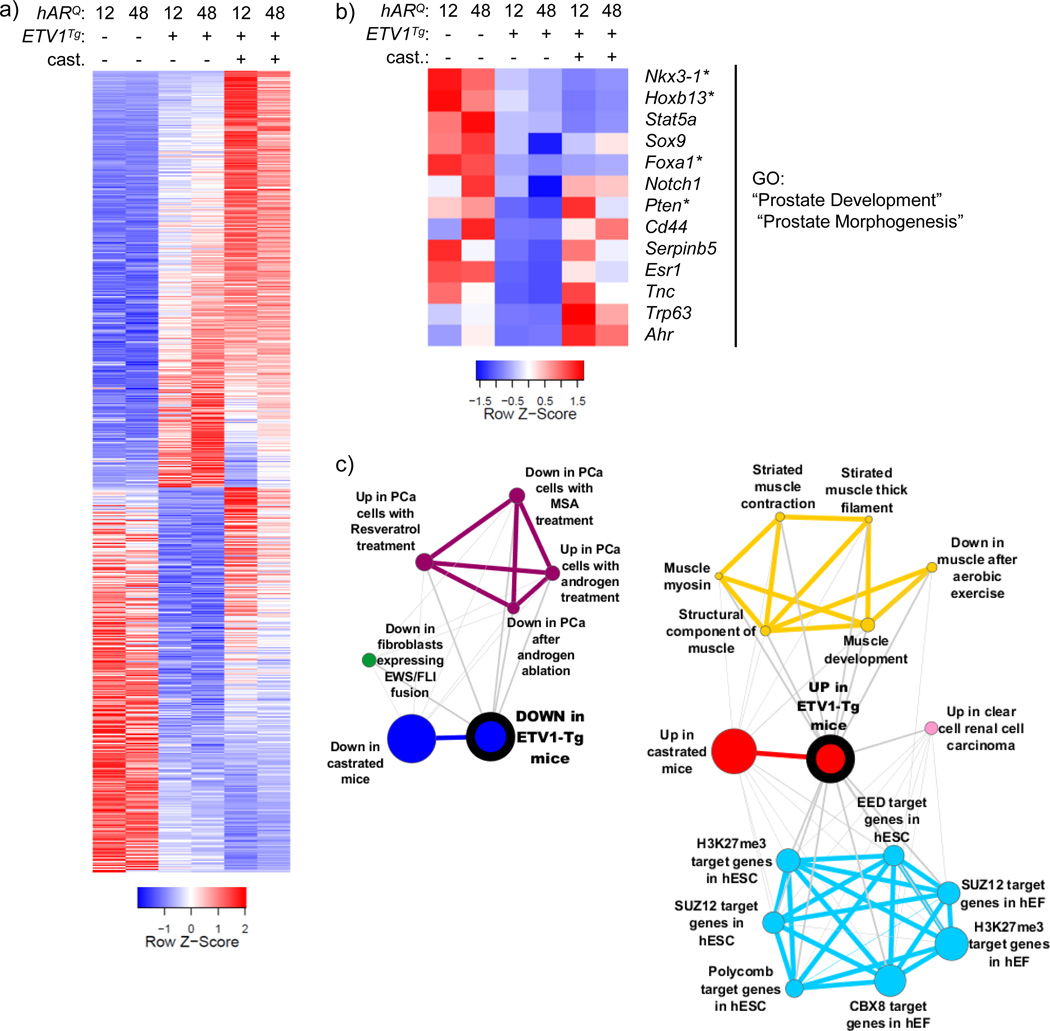
Fig. 3.
AR regulation is antagonized by ETV1 overexpression a The generalized linear model (GLM) tools in edgeR were used to test differential expression between all hAR;ETV1Tg and all hAR mice. 2368 genes were upregulated and 2196 downregulated in prostates of hAR;ETV1Tg mice (FDR ≤ 0.05) and are shown in the heatmap. Relative expression in prostates of castrated mice is included. The heatmap is plotted as in Fig. 2A, except that each column represents the average expression among biological replicate libraries. b Genes significantly upregulated or downregulated in prostates of hAR;ETV1Tg relative to hAR mice were uploaded to DAVID for functional annotation with gene ontology (GO) terms. The heatmap shows genes annotated with select significantly enriched GO terms (Benjamini FDR ≤ 0.05) among the downregulated genes. See Online Resource 2 for the complete list of significant GO terms. c The top 1000 upregulated and downregulated genes in prostates of hAR;ETV1Tg relative to hAR mice were converted to human gene symbols, uploaded to Oncomine as “custom concepts” and queried against the Oncomine concept database. Significantly enriched concepts, defined as having an odds ratio (OR) ≥ 4 and p ≤ 10−6, are shown as molecular concept maps. Node size is proportional to overlap with the primary concept. Similar concepts have the same color and are clustered together. See Online Resource 3 for a complete list of significant concepts.

