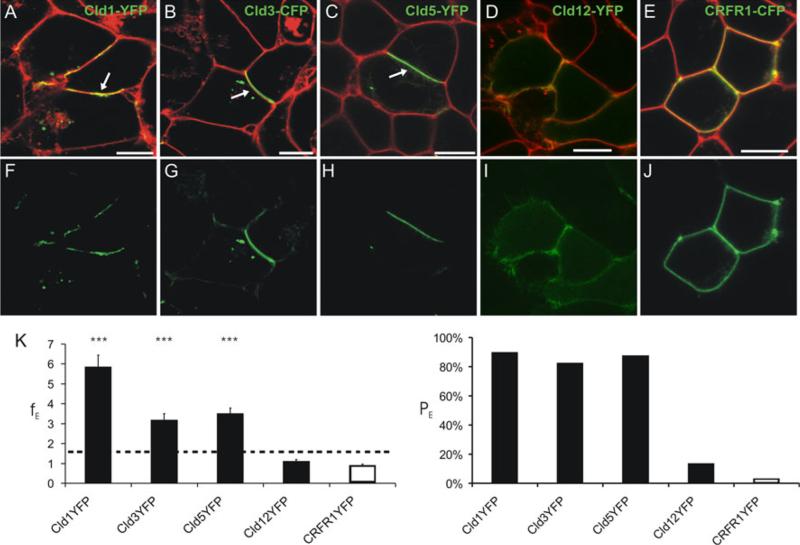
Fig. 1.
Homophilic trans-interaction of claudin (Cld)-1, -3, and -5 but not -12. Confocal microscopy of living HEK cells stably transfected with Cld1-YFP (a, f), Cld3-CFP (b, b), Cld5-YFP (c, h), Cld12-YFP (d, i), and transiently transfected with corticotropin releasing factor receptor 1 (CRFR1)-CFP (g, j). Cld1, -3, -5 but not -12 and CRFR1 (green) are enriched (arrows) at contacts between two claudin-expressing cells indicating trans-interaction. Plasma membrane was visualized with trypan blue (a–e, red). a–e, merge of CFP/YFP and trypan blue; f, h, i, YFP; g, j; CFP. Bar, 10 μm. k Quantification of contact enrichment. For Cld1, Cld3, and Cld5, but not Cld12, the factor of contact enrichment (EF) and the percentage of contacts with EF > 1.5 (PE) are much higher than for the negative control (CRFR1). ***p < 0.001 compared to CRFR1-YFP; EF, mean + SEM; n ≥ 40; dotted line, threshold above trans-interaction is considered

